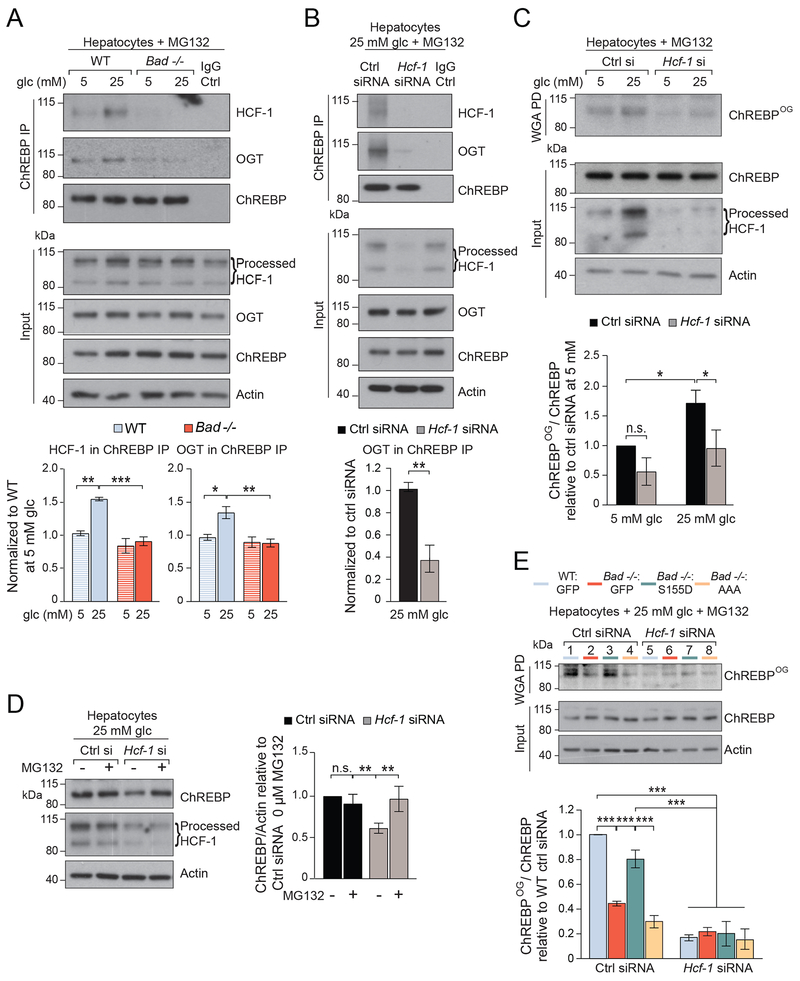
Figure 2. HCF-1 interacts with ChREBP and is required for its O-GlcNAcylation.
(A) Representative western blots (top) and quantification by densitometry of n=4 experiments (bottom) of ChREBP association with HCF-1 and OGT in WT and Bad −/− primary hepatocytes cultured in 5 or 25 mM glucose for 6 hrs in the presence of 20 μM MG132.
(B) Representative western blots (top) and quantification of n=3 experiments (bottom) of ChREBP association with HCF-1 and OGT following Hcf-1 knockdown in WT hepatocytes cultured in 25 mM glucose for 6 hrs in the presence of 20 μM MG132.
(C) Representative western blots (top) and quantification of n=3 experiments (bottom) of O-GlcNAcylated ChREBP (ChREBPOG) in wheat germ agglutinin (WGA) pull down (PD) assays in WT hepatocytes subjected to Hcf-1 knockdown and cultured as in (A).
(D) Representative western blots (left) and quantification of n=3 experiments (right) of ChREBP protein levels in WT hepatocytes subjected to Hcf-1 knockdown and cultured in 25 mM glucose for 6 hrs in the absence or presence of 20 μM MG132.
(E) Representative western blots (top) and quantification of n=3 experiments (bottom) of ChREBPOG in primary WT and Bad −/− hepatocytes reconstituted with the indicated BAD mutants, subjected to Hcf-1 knockdown, and cultured in 25 mM glucose for 6 hrs in the presence or absence of 20 μm MG132.
Error bars are means ± SEM, *p < 0.05; **p < 0.01; ***p < 0.001; n.s., nonsignificant; two way ANOVA (A, C, D, E) or one way ANOVA (B).
See also Figures S3 and S4.

