. 2019 Sep 13;8:e48240. doi: 10.7554/eLife.48240

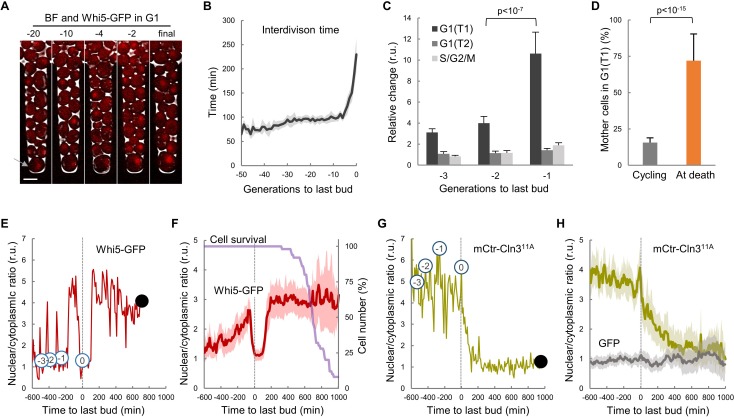
Figure 1. Yeast mother cells die mostly in G1 with low nuclear levels of cyclin Cln3.

(A) A yeast mother cell (arrow) expressing Whi5-GFP during aging at the G1 phase of indicated cycles before death. (B) Interdivision times (mean ±CL, n = 50) aligned to the last budding event. (C) Cell-cycle period lengths (mean ±CL, n = 50) in aging cells relative to young cells. (D) Percentage (±CL, n = 50) of cells in G1 in young cycling cultures or at death. (E) Nuclear levels of Whi5-GFP during the last generations (numbers in open circles) before death (closed circle) of an aging mother cell. (F) Nuclear levels of Whi5-GFP (mean ±CL, n = 50) in aging cells as in panel E aligned at the last budding event. (G–H) Nuclear levels of mCtr-Cln311A as in panels (E) and (F). Shown p-values were obtained using a Mann-Whitney U test. Bar = 5 µm. Results shown in this figure are representative of two replicate experiments.

Figure 1—source data 1. Yeast mother cells die mostly in G1 with low nuclear levels of cyclin Cln3.
elife-48240-fig1-data1.xlsx (624.6KB, xlsx)
DOI: 10.7554/eLife.48240.004

Figure 1.

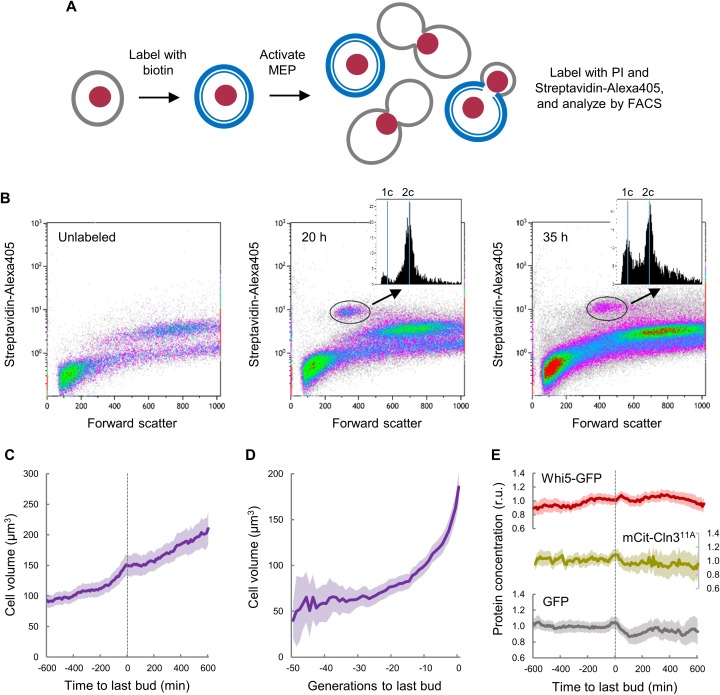
Figure 1—figure supplement 1. Yeast mother cells delay G1 progression with no major effects in growth during aging.

Figure 1—figure supplement 1.

(A) Cell labeling and MEP activation steps used for FACS analysis. (B) FACS distributions of cells labeled as in A after 20 hr and 35 hr of MEP induction to identify aging mother cells (circled) and obtain the corresponding DNA content distributions (insets). A plot with unlabeled cells is also shown. (C) Cell volume (mean ±CL, n = 50) of aging cells as a function of time around the last budding event. (D) Cell volume (mean ±CL, n = 50) during the whole lifespan of aging cells aligned at the last budding event. (E) Levels (mean ±CL, n = 50) of Whi5-GFP, mCtr-Cln311A and GFP as control in aging cells aligned at the last budding event.