. 2019 Sep 13;8:e48240. doi: 10.7554/eLife.48240

Figure 4. Asymmetric aggregate inheritance predicts a decrease in chaperone availability and a G1 arrest in aging cells.

(A) Scheme of the integrative mathematical model with chaperones playing concurrent roles in proteostasis and Start. (B–E) Predicted aggregate protein (B), available chaperone (C), and free folded Cln3 (D) levels and interdivision times in aging cells aligned at the last budding event. Values (mean ±CL, n = 75) are plotted as lines. Experimental (Exp) data from Figures 1B, H, 2F and 3E are also shown as insets for direct comparison.

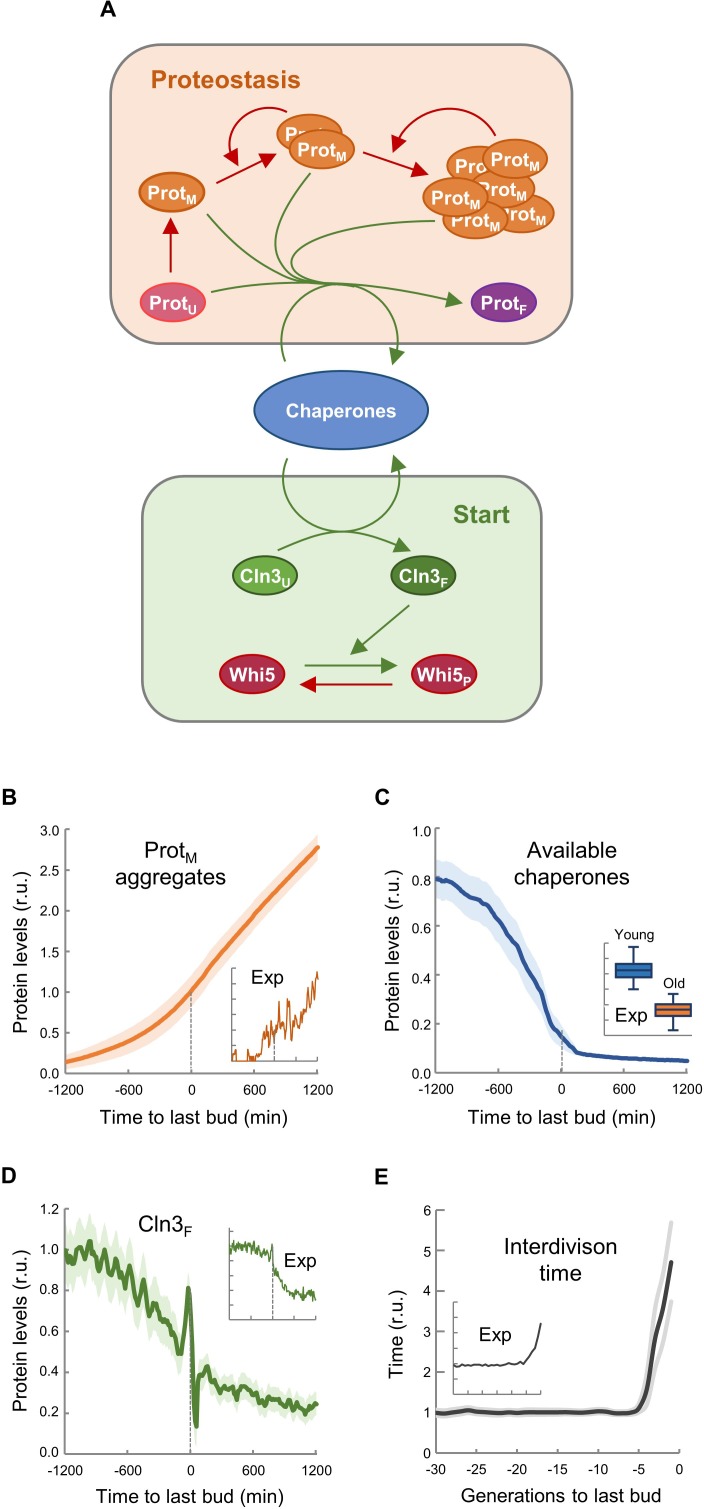
Figure 4—source data 1. Asymmetric aggregate inheritance predicts a decrease in chaperone availability and a G1 arrest in aging cells.
elife-48240-fig4-data1.xlsx (910.9KB, xlsx)
DOI: 10.7554/eLife.48240.018

Figure 4.

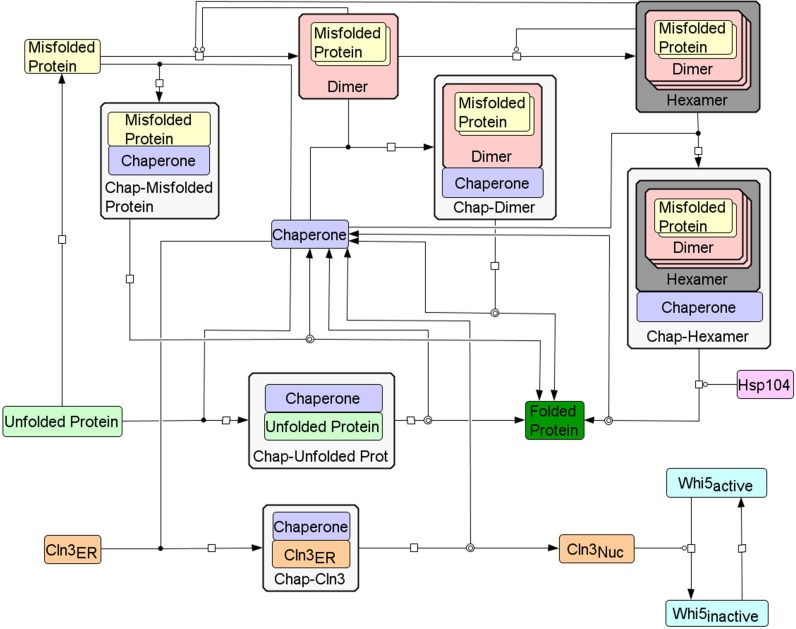
Figure 4—figure supplement 1. Wiring diagram of the integrative mathematical model.

Figure 4—figure supplement 1.

Wiring diagram of the model to describe the interaction between a minimal Start network and the protein folding/aggregation pathway. Chaperones can bind to all forms of unfolded and misfolded proteins, but misfolded dimers and hexamers require two or six chaperones, respectively, to properly refold all monomers. Although not shown in the wiring diagram, all species are subject to degradation reactions, and Cln3, chaperone and unfolded protein synthesis is set as a function of growth rate. Created using CellDesigner (Funahashi et al., 2008).
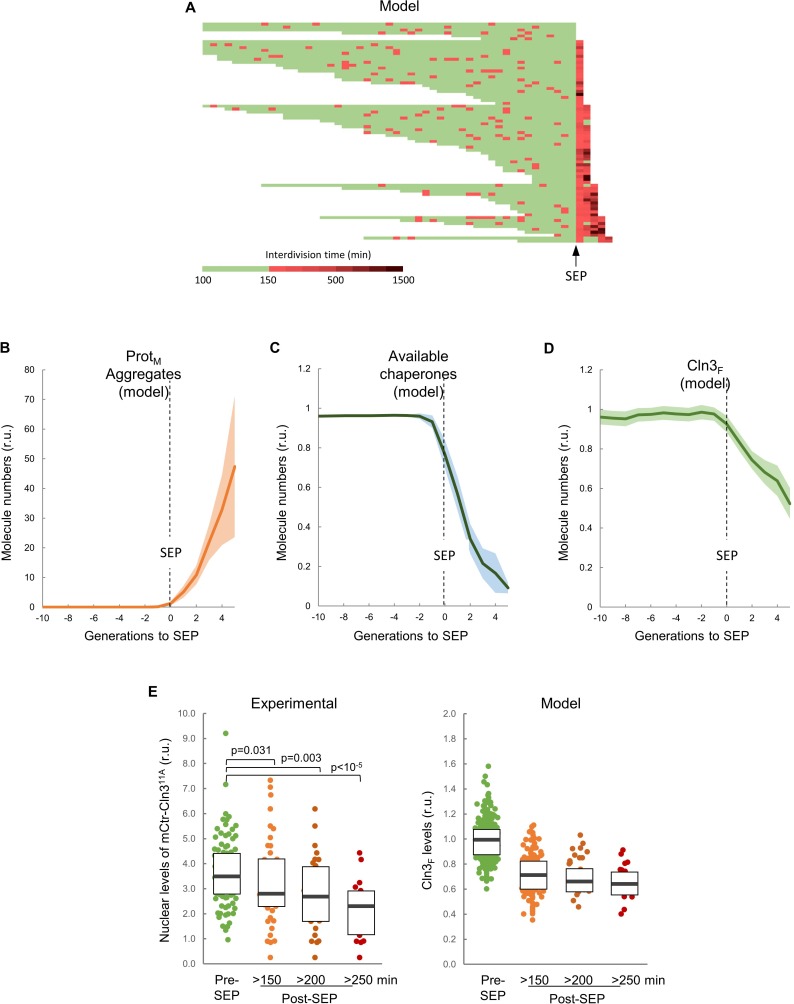
Figure 4—figure supplement 2. The integrative model predicts a decrease in chaperone availability and free Cln3 at the first generation after the SEP.

Figure 4—figure supplement 2.

(A) Interdivision times obtained by simulations. Independent runs were aligned at the generation in which the interdivision time was maintained over a fixed threshold afterwards so as to simulate the SEP. (B–D) Predicted aggregate protein (B), available chaperone (C), and free folded Cln3 (D) levels in aging cells aligned at the SEP as shown in panel A. Values (mean ±CL, n = 75) are plotted as lines. (E) Nuclear levels of mCitrine-Cln311A in cells (n = 150) before or at the indicated times after the SEP. Median ±Q values are also plotted. The plot on the right shows the predicted values of free folded Cln3 (Cln3F) obtained from independent simulations (n = 75) for the corresponding times. Shown p-values were obtained using a Mann-Whitney U test.
Figure 4—figure supplement 3. Lifespan of mutants and growth conditions as predicted by the integrative mathematical model.

Figure 4—figure supplement 3.

(A) Survival curves predicted for the indicated genotypes of cells (n = 75). (B) Survival curves predicted for wild-type fast-, medium- and slow-growing cells (n = 75). (C) Survival curves predicted for wild-type cells with initial large, medium and small cell sizes (n = 75). Simulations were obtained as shown in Supplementary file 3.