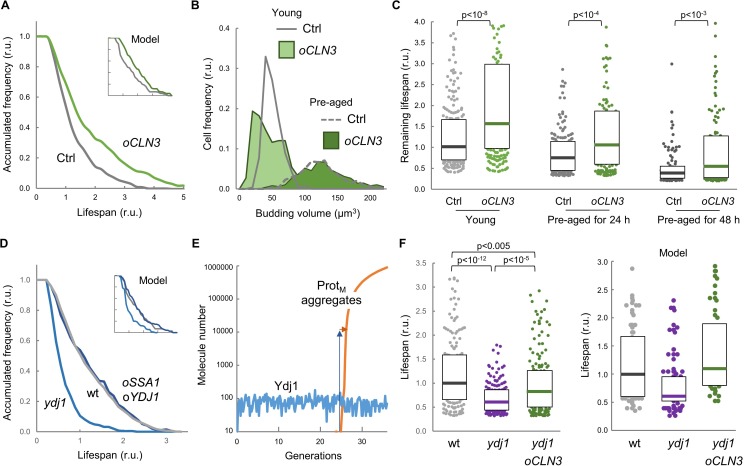
Figure 5. Enforced expression of Cln3 increases lifespan in a chaperone-dependent manner.
(A) Survival curves of control and CLN3 overexpressing cells (n > 300). Curves predicted by the integrative model in Figure 4A are also shown (inset). (B) Budding volume distributions (n > 250) of young or old cells pre-aged for 24 hr before induction of CLN3 expression. (C) Lifespan effects of CLN3 overexpression in young (n = 200) or old cells pre-aged for 24 hr (n = 150) and 48 hr (n = 100). Median ±Q values are also plotted. (D) Survival curves of wild-type, Ydj1-deficient and SSA1 YDJ1 overexpressing cells (n > 300). Curves predicted by the integrative model in Figure 4A are also shown (inset). (E) Simulation of free Ydj1 and ProtM aggregate numbers during successive replicative cycles in wild-type cells by the integrative model. The results of a representative run in stochastic mode are shown. A 2-order of magnitude increase in Ydj1 levels (blue arrow) would only cause a very small delay (orange arrow) in protein aggregation and, as a consequence, in lifespan. (F) Lifespan of wild-type (wt) and Ydj1-deficient cells with empty vector (ydj1) or overexpressing CLN3 (ydj1 oCLN3) (n = 150). Median ±Q values are also plotted. The plot on the right shows the predicted lifespan obtained from independent simulations (n = 75) for the corresponding genotypes. Shown p-values were obtained using a Mann-Whitney U test. Results shown in this figure are representative of at least two replicate experiments.


