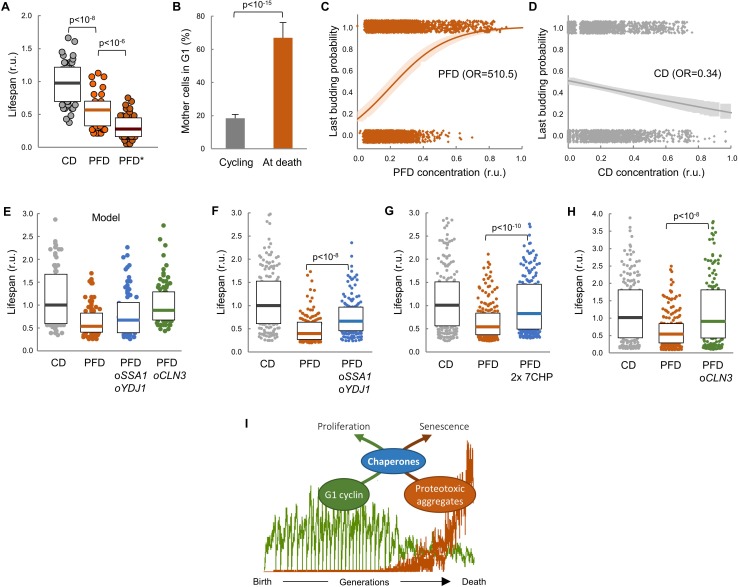
Figure 7. Lifespan shortening by protein aggregation can be overcome by enforced expression of chaperones or Cln3.
(A) Lifespan effects of CD or PFD expression in young cells in the CLiC microfluidics chamber (n = 50). Cells with PFD aggregates at the initial time point are indicated (*). Median ±Q values are also plotted. (B) Percentage (±CL, n = 57) of PFD expressing cells in G1 in young cycling cultures or at death. (C–D) Last budding probability within the following 180 min (twice the generation time of young mother cells) after reading PFD (C) or CD (D) cell concentration. Sampled single-cell data (closed circles) and the logistic regression lines (mean ±CL) are plotted. Odds ratios are also indicated. (E) Predicted lifespan effects of SSA1 YDJ1 overexpression and CLN3 overexpression in PFD expressing cells (n = 75). Predicted values for control CD-expressing cells are shown as reference. Median ±Q values are also plotted. (F–H) Lifespan effects of concerted SSA1 YDJ1 overexpression (F), duplication of seven chaperone genes (2 × 7CHP: SSA1, YDJ1, HSP82, CDC37, CDC48, UFD1 and NPL4) (G) or CLN3 overexpression (H) in PFD expressing cells (n > 150). Values of control CD-expressing cells are shown as reference. Median ±Q values are also plotted. (I) By compromising chaperone availability, proteostasis deterioration would exclude cyclin Cln3 from the nucleus and, as a direct consequence, drive the cell into senescence. Shown p-values were obtained using a Mann-Whitney U test. Results shown in this figure are representative of at least two replicate experiments.


