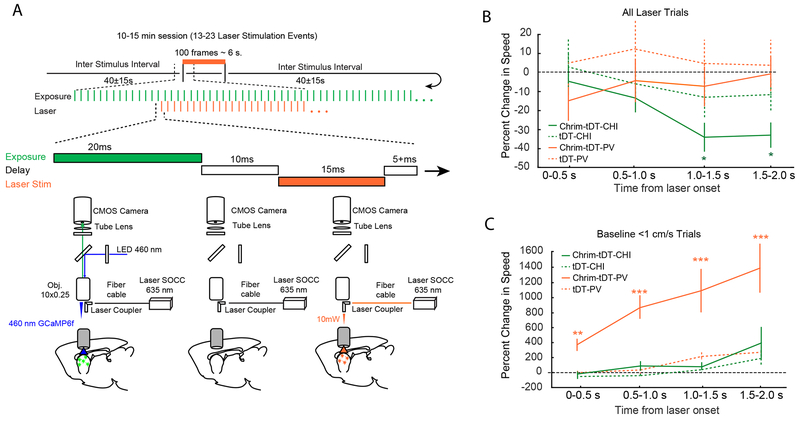
Figure 3: Optogenetic Stimulation of Interneuron Populations Modulates Movement.
(A) Simultaneous optogenetic stimulation and imaging experimental design. (top) Animals were imaged over 10-15 continuous minutes and received 13-23 trials of optogenetic stimulation with an ITI of 40±15seconds. Each trial consisted of 100 laser stimulation pulses at ~15 Hz. Red laser light was pulsed between GCaMP6f imaging frames. (bottom), Cartoon depicting alternating GCaMP6f image acquisition and red laser light delivery for Chrimson activation through the imaging window across successive frames. (B) Normalized change in movement speed at laser onset for PV-Chrimson and Chat-Chrimson mice for all trials (n=4 PV-Chrimson mice, and n=4 Chat-Chrimson mice, 2 sessions for each mouse). Line plots and error bars indicate mean ⩲SEM. Significant reductions in speed coincided with laser onset only in Chat-Chrimson mice (Mixed-effects model, ANOVA: F(4,645)=6.7, p < 0.001; comparisons of time windows: 0-500ms; t(645)= −0.91, p=0.36, 500-1000ms; t(645)=−1.8, p=0.11, 1000-1500ms; t(645)=−3.8, p=6.2e-04; 1500-2000ms, t(645)=−3.6, p=8.1e-04. *=p<0.01, Benjamini-Hochberg corrected). This effect was not present in PV-Chrimson mice (Mixed-effects model, ANOVA: F(4,575)=1.4, p=0.24), or in control mice (n=4 PV-tDTomato mice, and n=4 Chat-tDTomato mice, 2 sessions for each mouse; PV-tDTomato mice: Mixed-effects model, ANOVA: F(4,580)=6.0, p=0.60; Chat-tDTomato mice: Mixed-effects model, ANOVA: F(4,580)=2.2, p=0.07). (C) Normalized change in movement speed following laser onset for PV-Chrimson and Chat-Chrimson mice when stimulation occurred during periods of low movement. Line plots and error bars indicate mean ⩲ SEM. Laser stimulation increased movement only in PV-Chrimson mice (Mixed-Effects Model, ANOVA F(4,200)=5.4, p=4.0e-04; baseline vs time=0-500ms: t(200)=3.16, p =0.0018; baseline vs time=500-1000ms: t(200)=4.3, p=6.2e-05; baseline vs time=1000-1500: t(200)=3.6, p=6.0e-04; baseline vs time=1500-2000 ms: t(200)=4.3, p=6.2e-05), but not in Chat-Chrimson mice (Mixed-effects model, ANOVA: F(4,130)=1.7, p=0.15) or in control mice (PV-tDTomato: Mixed-effects model, ANOVA: F(4,170)=2.2, p=0.07; Chat-tDTomato mice: Mixed-effects model, ANOVA: F(4,150)=1.2, p=0.31, n=4 tDTomato mice, and n=4 Chat-tDTomato mice, 2 sessions from each mouse). *=p<0.05, **=p<0.01, ***=p<0.001.

