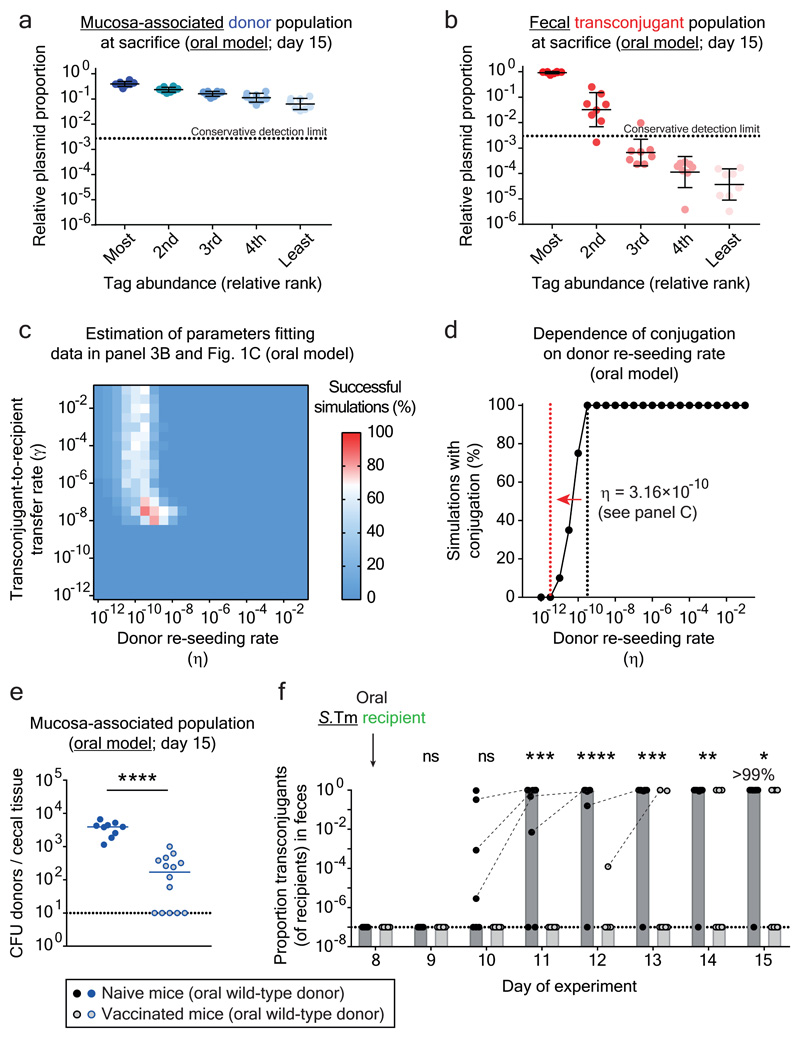
Figure 3. Plasmid transfer is initiated by rare donor re-seeding events and can be prevented by vaccination.
Mice were orally infected (Fig. 1b) with tagged donor (five SL1344 P2cat TAG; SmR, CmR) and recipient mixtures (five 14028S TAG strains; KanR, AmpR; n=8 mice; three independent experiments). Donors, recipients and transconjugants were enumerated by plating (Extended Data Fig. 7a) and plasmid-tag distributions analyzed by qPCR (raw data shown in Extended Data Fig. 6b). a-b) Plasmid-tag distribution in mucosa-associated donors and fecal transconjugants at day 15. Dotted lines indicate conservative qPCR detection limits (2.9×10⁻³). Line indicates mean; error bars indicate standard deviation. c) Modeling results. Simulations are described in the supplementary discussion. A rate of donor re-seeding and donor-to-recipient conjugation of η = 3.16×10⁻¹⁰ per day and a rate of transconjugant-to-recipient conjugation of γ = 3.16×10⁻⁸ per CFU/g feces per day optimally fit the data (red). d) Effect of η on transconjugant detection. Analysis as described in the supplementary discussion. Reducing η by 100-fold below the value estimated for naïve mice (black dotted line; η = 3.16×10⁻¹⁰) diminishes transconjugant detection (red dotted line). e-f) Vaccination diminishes conjugation. Mice vaccinated with killed S.Tm (open circles; n = 14; four independent experiments) or PBS (naïve; closed circles; n = 9; three independent experiments) were infected with tagged donor and recipient mixtures as in panel a-b. Donors, recipients and transconjugants were enumerated by plating. e) Mucosa-associated donor populations at day 15. f) Fecal transconjugant proportions in naive (black circles; grey bars indicate median) or vaccinated mice (light gray circles; light gray bars indicate median) from panel e. Dashed lines connect data points from the same mice. Statistics are performed using a two-tailed Mann-Whitney U test (p>0.05 (ns), p<0.05 (*), p<0.01 (**), p<0.001 (***), p<0.0001 (****)). Dotted lines: detection limits.

