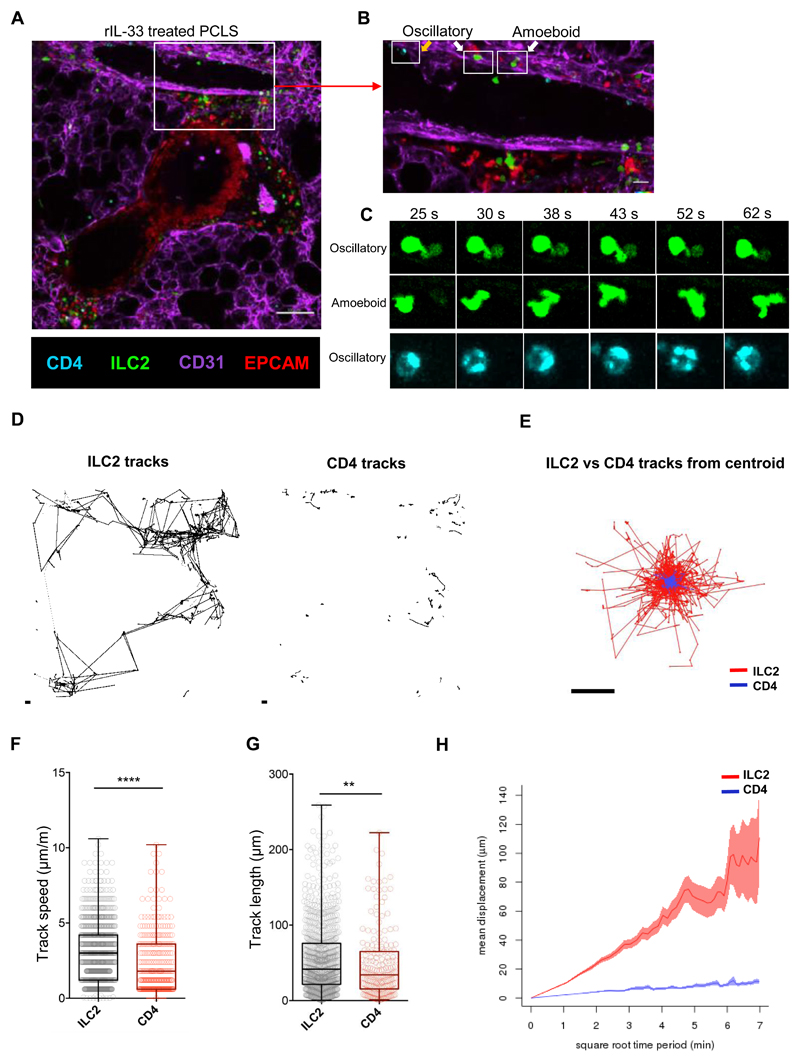
Fig 2. rIL-33 stimulation induces ILC2 motility around blood vessels and airways.
IL13-eGFP mice were treated with 3 doses of rIL-33 (1μg per dose), over 1 week and culled 24h after the final dose. Live viable precision cut lung slices (PCLS) of 200μm thickness were obtained and stained for CD31 (Magenta, the lung structure and blood vessels), CD4 (cyan, T cells, orange arrow), EpCAM (Red, to visualise bronchial epithelium) and GFP (ILC2, white arrow), and time-lapse video taken (1024μm x 1024μm field of view (FOV), 45 min duration under a 20x objective using an inverted confocal microscope) (A) Static image depicting the location of ILC2 and CD4+ T cells, scale bar 100 μm. (B) Zoomed in section of the blood vessel in figure 2A, scale bar 20 μm. (C) High power images of boxed cells in figure 2B showing differences in pattern of cell movement (oscillatory vs amoeboid movement). ILC2 and CD4+ T cells dynamics were tracked and plotted as (D) individual tracks or (E) tracks commencing from centroid and overlaid. (F) Track speed, (G) track length and (H) track displacement were quantified. Representative images shown in (A-C) are from rIL-33 treated mice, where n = 6 mice per treatment (3 slices per mouse were imaged). For (F-H) in box and whiskers plots, each dot represents an individual cell. Data are representative from 4 experiments where n = 6 mice per treatment. *p < 0.05, **p < 0.01, ***p < 0.001 and, **** p < 0.0001.

