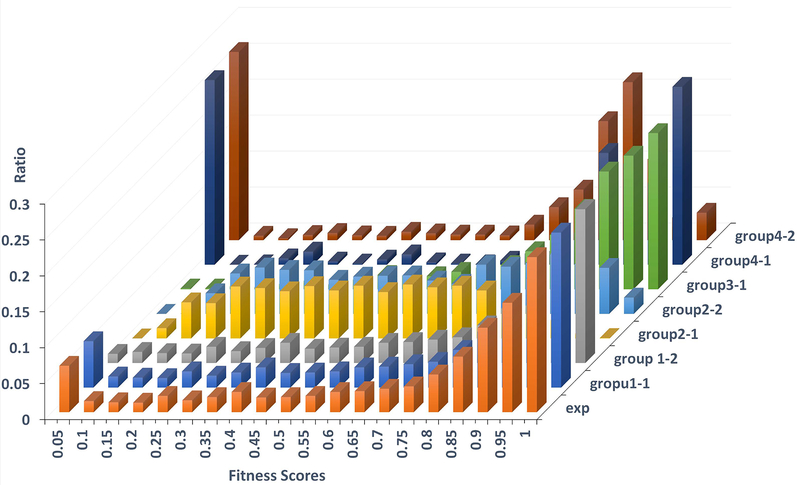
Figure 1. The distribution of experimental fitness scores and predictions.
The 3D plot depicts the ratio (Y-axis) of fitness scores (X-axis) from experiment (exp) and all participants (depth axis). All negative fitness scores and predictions are shifted to 0, as the challenge requires non-negative predictions.

