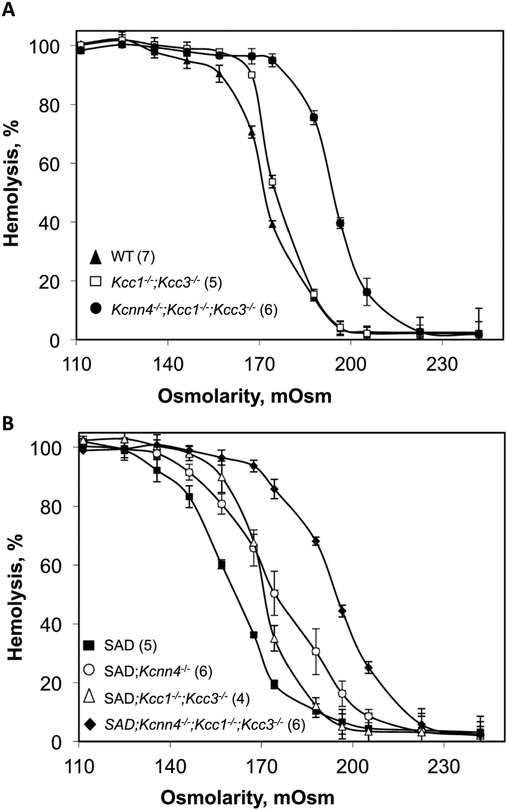
Fig. 4. Red cell susceptibility to osmotic lysis as function of genotype.
A. Osmotic lysis curves of red cells from WT mice (black triangles; pooled data from WTSAD (n=3) and WTKcnn4 (n=4)) compared with osmotic lysis curves of red cells from Kcc1−/−;Kcc3−/− mice (open squares) and from Kcnn4−/−;Kcc1−/−;Kcc3−/− mice (black circles). B. Osmotic lysis curves SAD mice (black squares) compared with those of red cells from SAD;Kcnn4−/− mice (open circles), SAD;Kcc1−/−;Kcc3−/− mice (open triangles), and SAD;Kcnn4−/−;Kcc1−/−;Kcc3−/− mice (black diamonds). Values are means ± SEM for (n) independently tested pooled samples from each genotype.

