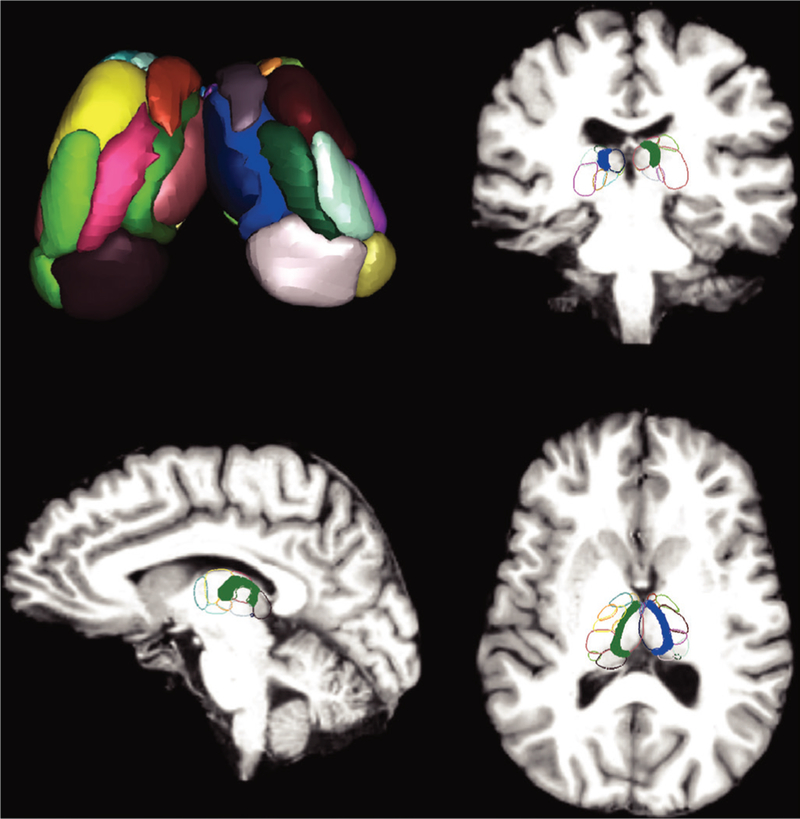
Figure 2.
Thalamic atlas shown here is the active shape modelthalamic atlas with all 23 bilateral intrathalamic nuclei (46 total nuclei) volumetrically rendered in the top left. Four nuclei with masks smaller than two voxels (mean across participants) were excluded, and 19 bilateral (38 total) nuclei were used for analyses. MRI coronal, sagittal, and axial slices show the same atlas overlaid on a standard Montreal Neurological Institute space brain with each nucleus outlined in colour. In the coronal, sagittal, and axial slices, the CL intralaminar thalamic nuclei are highlighted in solid blue and green. For analyses involving the whole thalamus, the Harvard-Oxford atlas entire thalamus was used, whereas for connectivity analyses using CL the highlighted nuclei were used. CL, central lateral.

