
Figure 3. Urea-induced equilibrium unfolding of FXN wild type and variants.
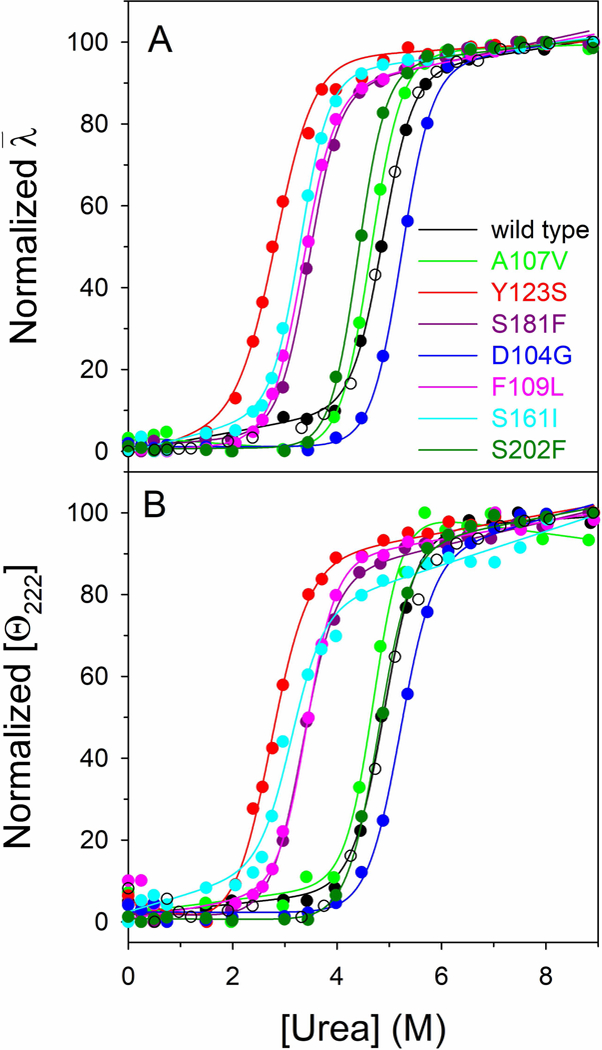
(A) Normalized intensity-averaged emission wavelength . (B) Normalized molar ellipticity at 222 nm ([Θ222]) reported after removal of the high-frequency noise and the low-frequency random error by SVD. The continuous lines represent the nonlinear fitting of the normalized and [Θ222] data to Eq (3). The reversibility points (empty circles) are shown, for clarity, only for the wild type and were not included in the nonlinear regression analysis. All spectra were recorded at 20 °C, as described in Materials ad Methods.