
Figure 4. Chevron plots.
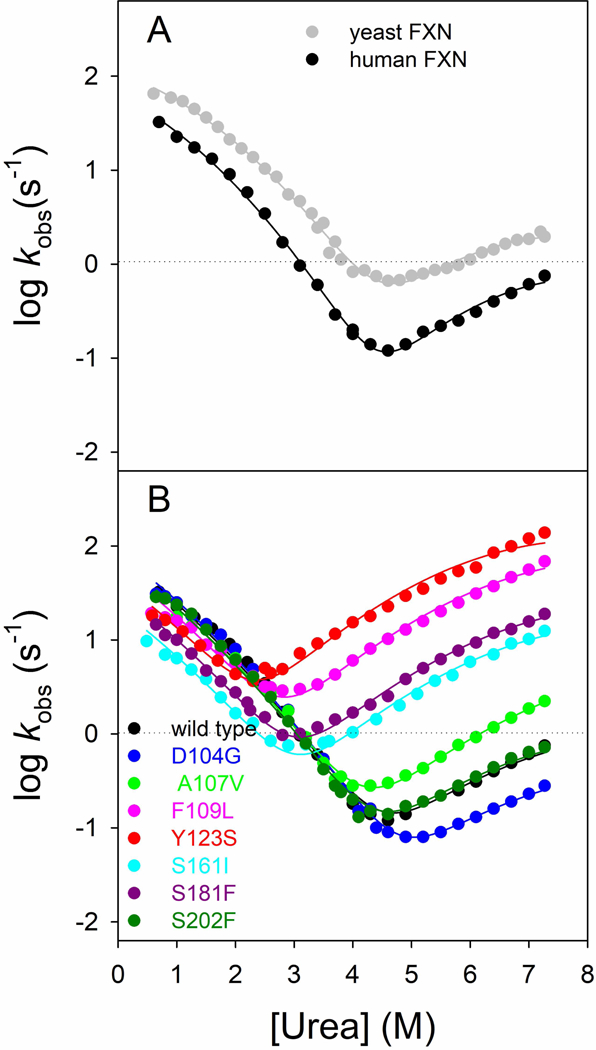
(A) Chevron plots of human (black squares) and yeast frataxin (data from Bonetti et al., 2014, gray circles). Data are fitted with an equation that takes into account a broad energy barrier in the transition state. (B) Chevron plots of FXN wild type and variants p.D104G, p.A107V, p.F109L, p.Y123S, p.S161I, p.S181F, p.S202F in 50 mM Tris-HCl, 100 mM NaCl, 1 mM DTT, pH 8.5, at 37°C. A global fit analysis was performed, sharing the mf and mu values for all the data sets (see details in the text).