
Figure 6. Cluster formation.
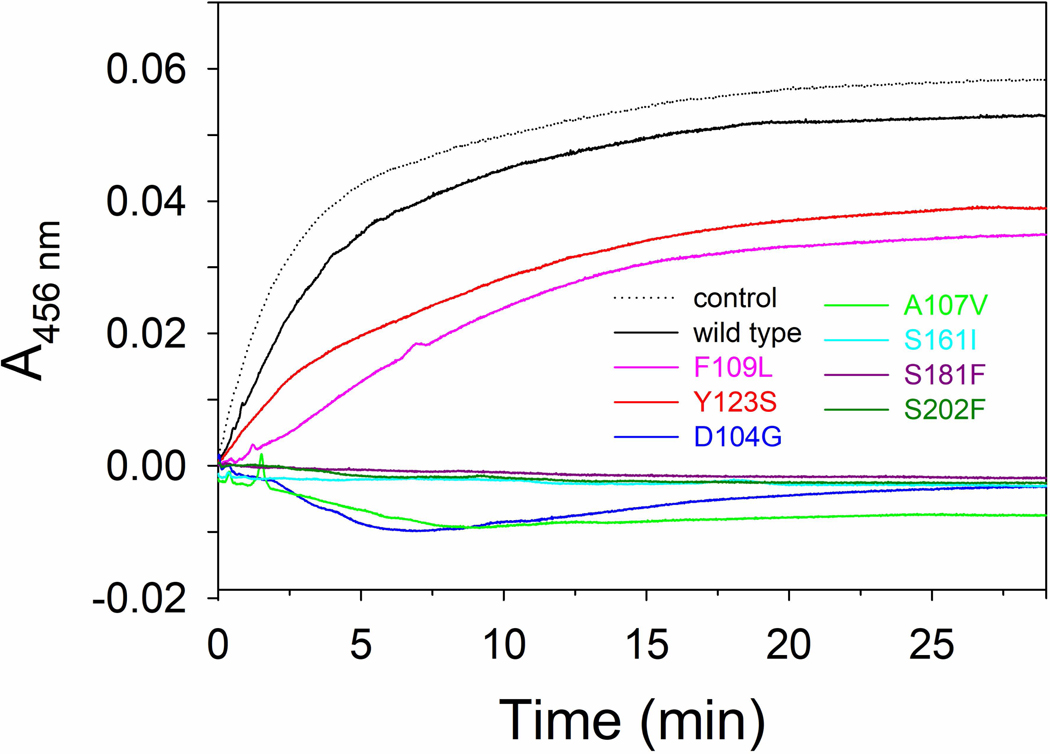
Cluster formation rates on IscU (50μM) in the presence of 1μM IscS, 3 mM DTT with 250 μM Cys, and 25 μM Fe2+. The curves were recorded in the absence (dotted line) or in the presence of 50 μM of FXN wild type and variants. Negative values are due to imperfect subtraction from the baseline and should be considered as zero (full inhibition).