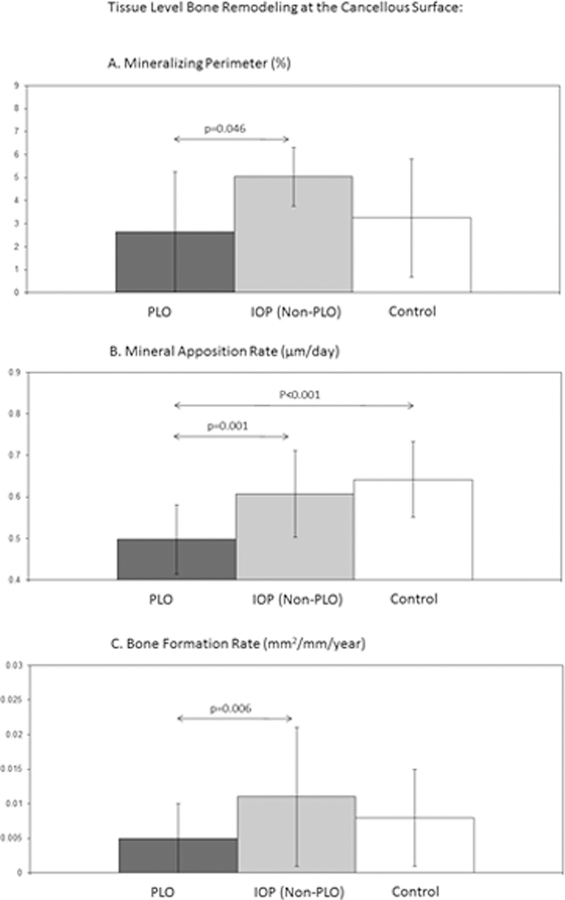
Figure 3.
Tissue Level Bone Remodeling: Mean (± SD) mineralizing perimeter (Figure 3A), mineral apposition rate (Figure 3B) and bone formation rate (Figure 3C) at the cancellous surface on transiliac crest bone biopsy samples obtained after tetracycline labeling in the untreated state in premenopausal women with PLO, those with IOP (non-PLO), and healthy premenopausal controls. P values are shown for significant between groups comparisons; arrows designate groups compared via t test.

