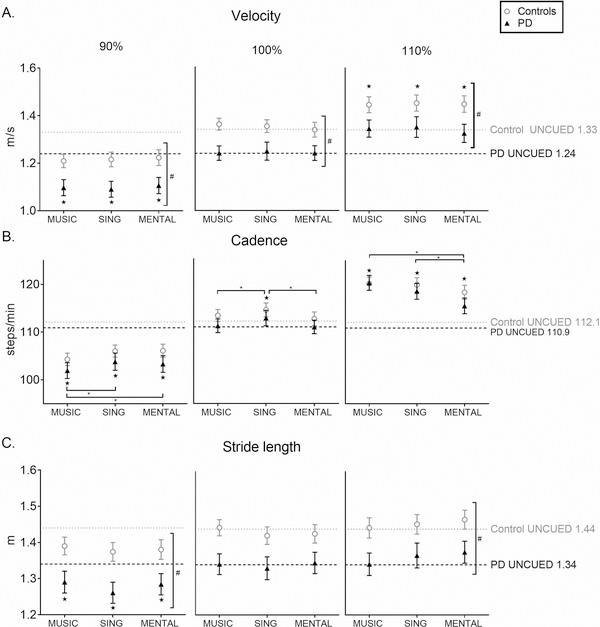
Figure 1.
Gait Characteristics
Gait characteristics of velocity (A), cadence (B), and stride length (C) across conditions as compared to UNCUED walking at three different tempos: 90%, 100%, and 110% of preferred walking cadence. All bars represent means ± SEM. The gray and black dotted lines represent the Control group and PD group baseline mean values, respectively. Horizontal significance bars indicate an overall effect of condition. ★ indicates significant difference from UNCUED across groups. * indicates between-condition difference across groups. # indicates between-group difference across conditions.

