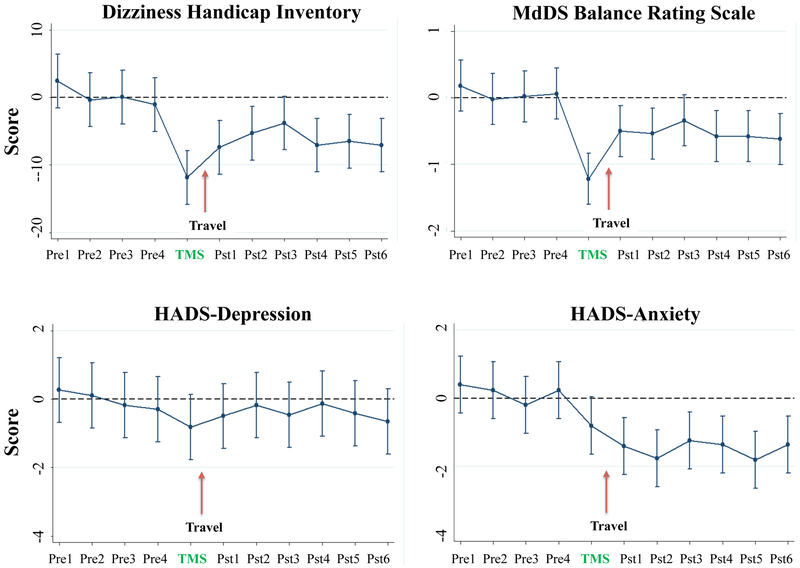
Figure 4: Longitudinal cTBS effects on DHI, MBRS, and HAD scores.
Linear prediction model of repeated measures ANOVA with 95% confidence intervals presented for four baseline measurements, post TMS week, and six weeks post treatment for the DHI, MBRS, and the HADS Anxiety and Depression components. Pre= pre TMS scores, Pst= post TMS scores.

