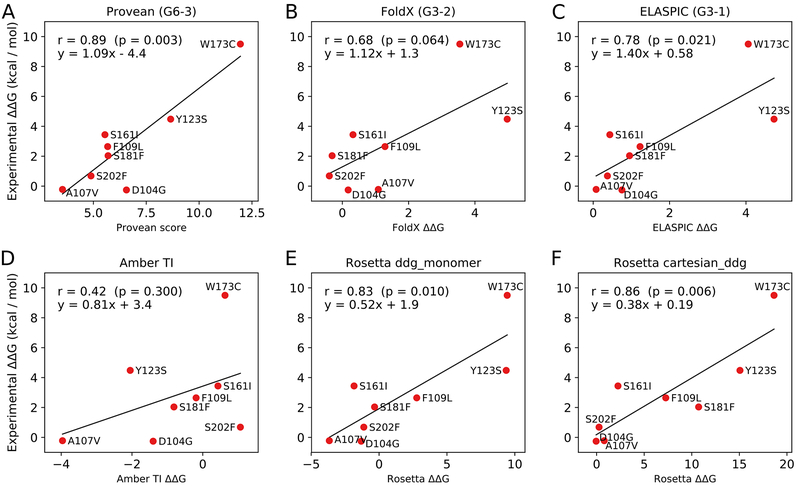
Figure 1.
(A-C) Correlation between predicted and experimental values for Provean, FoldX, and ELASPIC, which formed our three submissions to the CAGI5 frataxin challenge (submission identifiers G6–3, G6–2, and G6–1, respectively). (D-F) Correlations between predicted and experimental values for Amber TI, Rosetta’s ddg_monomer protocol, and Rosetta’s cartesian_ddg protocol. Those predictions were not submitted to the CAGI5 frataxin challenge and did not undergo blind assessment. The ΔΔG values shown in the plots correspond to changes in the Gibbs free energy of protein folding.

