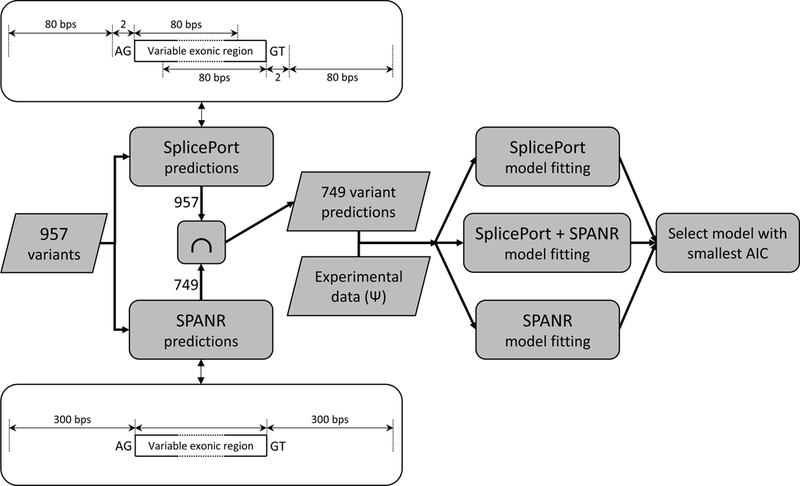
Figure 2.

Flowchart representation of the computational steps performed for selection of the mathematical model to be used for predicting splicing impact of variants in the test set. The schematic representations associated with the SplicePort and SPANR prediction steps indicate the genomic regions containing mutations for which their impact can be evaluated by each tool. Specifically, SplicePort can evaluate the impact on variants located within 80 bps of either splice site (AG indicates the 3’ or the acceptor site, whereas GT indicates the 5’ or donor splice site). SPANR can evaluate the impact of exonic mutations as well as mutations located up to 300 bps away. Exon lengths in the Vex-seq dataset vary between 69 and 98 bps, and are illustrated as “Variable exonic region”.
