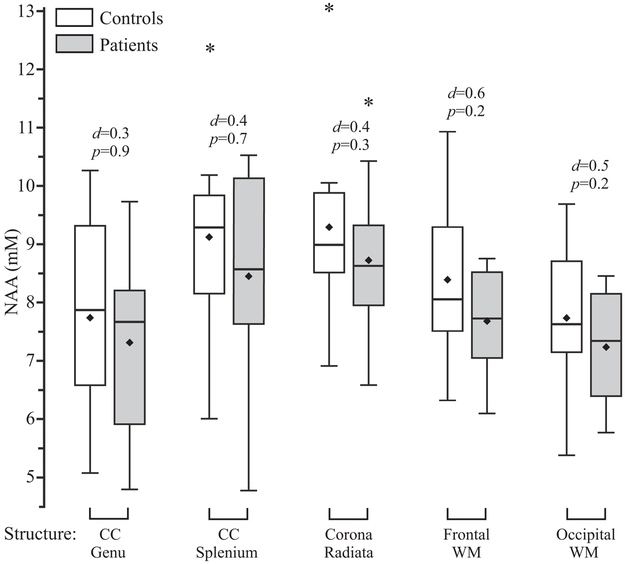
Fig. 3.
Box plots showing the 1st, 2nd (median), and 3rd quartiles (box), ±95% (whiskers), means (♦) and outliers (*) of the NAA absolute concentration distributions of the controls and patients with PCS mTBI for each WM ROI. Above each box plot pair are the p value from the analysis of covariance and the Cohen’s d value as a measure of the effect size. Note that (a) despite lack of significant differences for any WM ROI, for each case the median (and mean) of the patients’ NAA concentration is lower than the controls’; and (b) the Cohen’s d values are all within a relatively narrow range, from 0.3 (genu) to 0.6 (frontal WM). Since the patients’ average global WM NAA level was significantly lower than their controls (14), these distributions seem to imply the presence of diffuse injury across all WM ROIs which is, however, beneath the sensitivity threshold of the 1H MRSI regional analysis.

