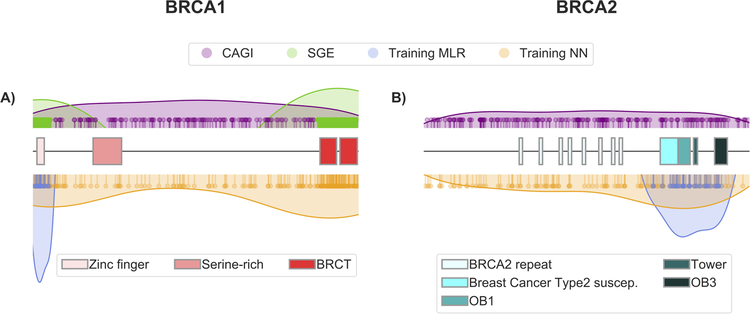
Figure 6. Distribution of the variants along the BRCA1 and BRCA2 sequences.
Each variant dataset used in this work is represented with a set of pins (indicating the location of each variant) and a colored surface that provides a general, smoothed view of the distribution. The different functional domains in each structure are represented with boxes; for representation purposes, BRCA1 (1863 aa) and BRCA2 (3418 aa) are displayed with the same length. The color codes for the different sets are: CAGI (lilac), SGE (green), MLR training (blue) and NN training (orange).

