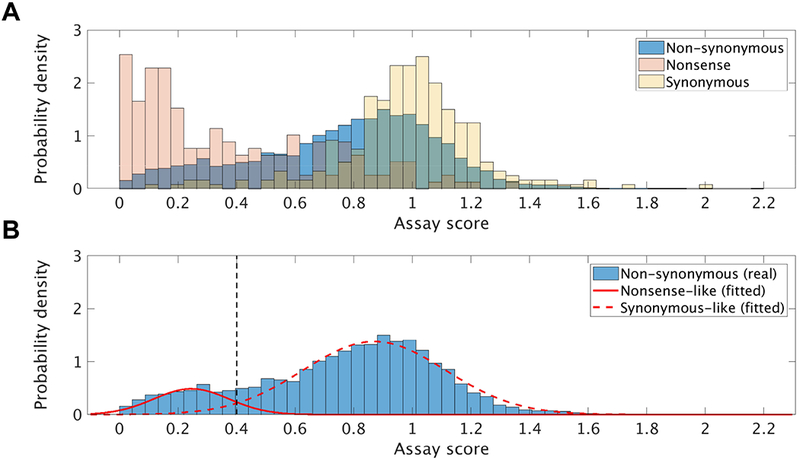
Figure 1. Experimental VSP score distributions.

For consistency with the MSGMM algorithm, probability density functions were plotted instead of raw counts or frequencies. (A) Distribution of all variant types (bar heights correspond to the frequency of variants from each bin divided by the bin-width, 0.044) and (B) Gaussians fitted to the non-synonymous distribution using the MSGMM algorithm (with parameters learned from the synonymous distribution). The black dashed line corresponds to the estimated threshold that separates likely stability-impacting variants from synonymous-like ones.
