Fig. 6.
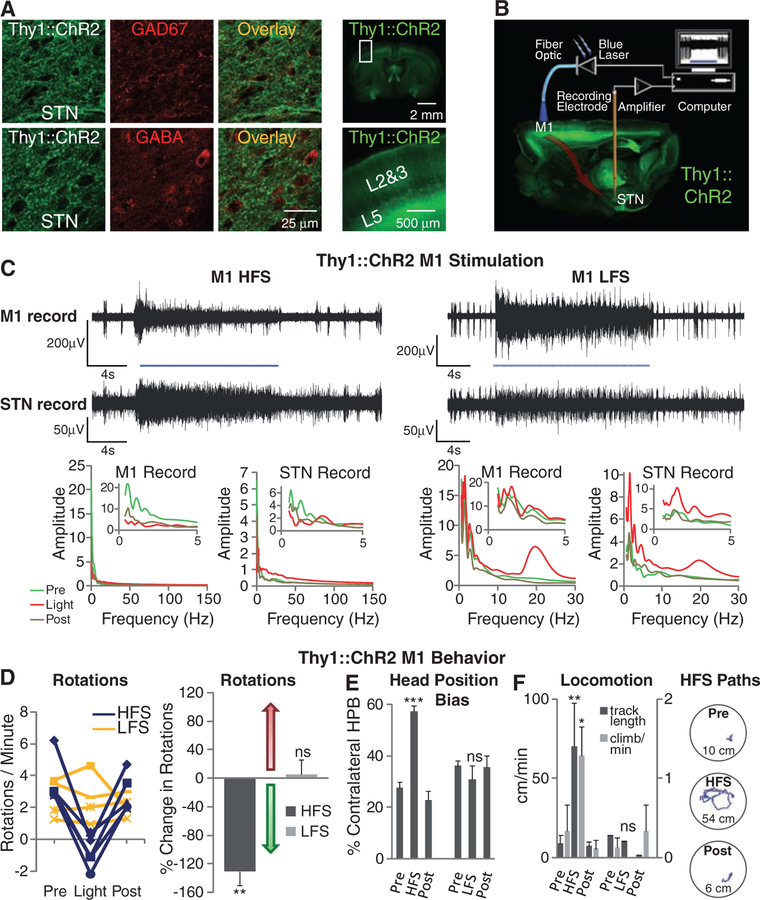
Selective optical stimulation of layer V neurons in anterior primary motor cortex. (A) GAD67 and GABA staining showed no colocalization with Thy1::ChR2-EYFP in STN (left). Apical dendrites of layer V neurons can be seen rising to the pial surface (22, 23) (right). (B) Schematic for optical stimulation of M1 with simultaneous recording in STN of Thy1::ChR2 mice. (C) Optical stimulation (473 nm) of M1 and simultaneous recording in STN of anesthetized Thy1::ChR2 mice. Optical HFS (130 Hz, 5-ms pulse width) of M1 modulated activity in both M1 and STN. Optical LFS (20 Hz, 5-ms pulse width) of M1 produced 20-Hz tonic firing in both M1 and STN. (D) Optical HFS (130 Hz, 5-ms pulse width) reduced amphetamine-induced ipsilateral rotations in 6-OHDA Thy1::ChR2 mice (P < 0.01, n = five mice) in contrast to optical LFS (20 Hz, 5-ms pulse width, P > 0.05, n = four mice); t test with μ = 0. (E) Contralateral head position bias was corrected in HFS (HFS versus light off: P < 0.001, n = four mice), whereas LFS had little effect (LFS versus light off: P > 0.05, n = three mice); two-sample t test. (F) HFS but not LFS to M1 significantly increased path length (HFS, P < 0.01, n = two mice) and climbing (P < 0.05, n = three mice); two-sample t test. Sample paths before, during, and after HFS are shown (100 s each, path lengths noted in cm).

