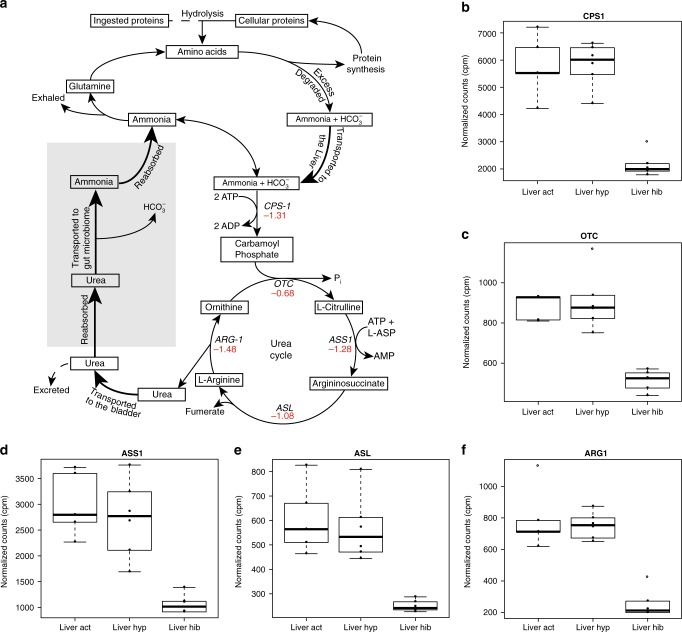
Fig. 6.
Urea cycle downregulated during hibernation. a Schematic of the path proteins (either ingested or recycled) take in the body. Thick arrows indicate movement of compounds through the body. Numbers under enzyme names indicate log2 fold change observed during hibernation in liver. Red numbers indicate significantly decreased expression in hibernation (FDR < 0.05, Supplementary Data 2). Dashed lines show pathways that occur normally during active season but do not occur during hibernation. The gray box highlights the step of urea reabsorption and transport to the gut microbiome with produced ammonia being absorbed across the gut lumen. b–f Normalized counts (counts per million, cpm) from liver for the five genes in the urea cycle plotted across active (Act), hyperphagia (Hyp), and hibernation (Hib). All box plots have the following elements: center line, median; box limits, upper and lower quartiles; whiskers, ×1.5 interquartile range; points, outliers open circles. N = 6 animals

