Figure 3.
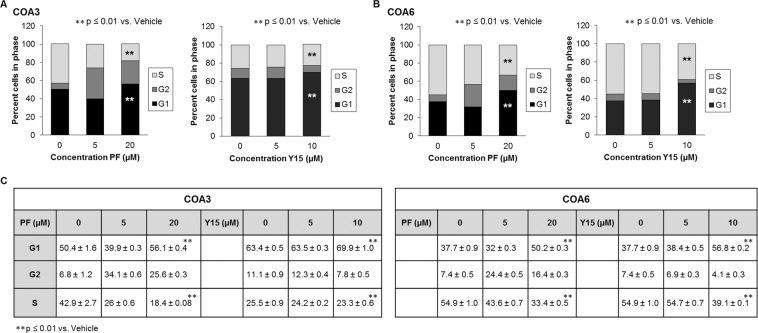
FAK inhibition diminished progression through the cell cycle. (A) COA3 cells (3 × 10⁶) were treated with increasing doses of PF (0, 5, 20 μM) or Y15 (0, 5, 10 μM) for 72 hours. Cells were stained with propidium iodide and cell cycle was analyzed via flow cytometry. FAK inhibition led to an increase in percentage of cells in the G1 phase and a decrease in percentage of cells in S phase. This change was statistically significant and represents failure to progress through the cell cycle. (B) COA6 cells (3 × 10⁶) were treated with increasing doses of PF (0, 5, 20 μM) or Y15 (0, 5, 10 μM) for 72 hours. Cells were stained with propidium iodide and cell cycle was analyzed via flow cytometry. FAK inhibition led to an increase in percentage of cells in the G1 phase and a decrease in percentage of cells in S phase. This change was also statistically significant, representing failure to progress through the cell cycle. (C) Cell cycle data are presented in tabular form. Data represent at least three biologic replicates and are reported as mean ± SEM.

