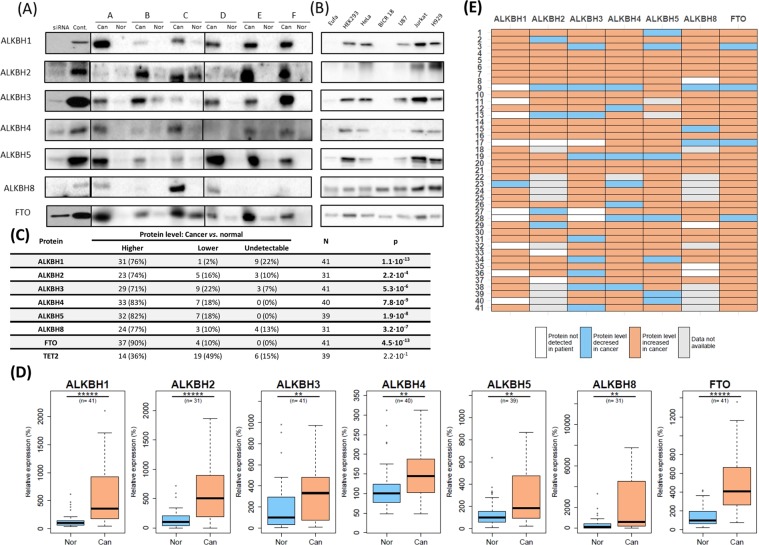
Figure 1.
ALKBH expression in HNSCC and indicated cell lines: (A) WB analysis of ALKBH expression in HNSCC samples. siRNA - HeLa cells treated with siRNAs directed towards particular ALKBHs; Cont. - HeLa cells not treated by siRNA; Nor - normal periphery; Can- cancer; A-F - tumour samples. (B) WB analysis of ALKBH expression in various cell lines: normal, cancer and embryonic. (C) ALKBHs expression in cancer and normal tissues from HNSCC patients. Samples were classified into three groups according to the expression level of each protein: (i) stronger signal from cancer than normal surrounding; (ii) weaker signal from cancer than normal surrounding; (iii) no detectable expression of the proteins in the normal and cancer tissue. N – number of patients; p - p-value obtained from the Wilcoxon signed-rank test for paired samples. (D) Nonparametric Wilcoxon rank-sum test (for groups) were performed. n- number of samples from each group; P-values with Benjamini-Hochberg adjustment: *p < 0.025; **p < 0.005; ***p < 0.0005; ****p < 0.00005; *****p < 0.000005. (E) Heat map of changes of individual protein expression in HNSCC. Fold changes were calculated for tumour vs. adjacent normal tissue. White - no detectable expression of particular protein in cancer and adjacent tissue. Blue - decreased relative protein level. Orange - increased relative protein level. Grey - no data gathered.

