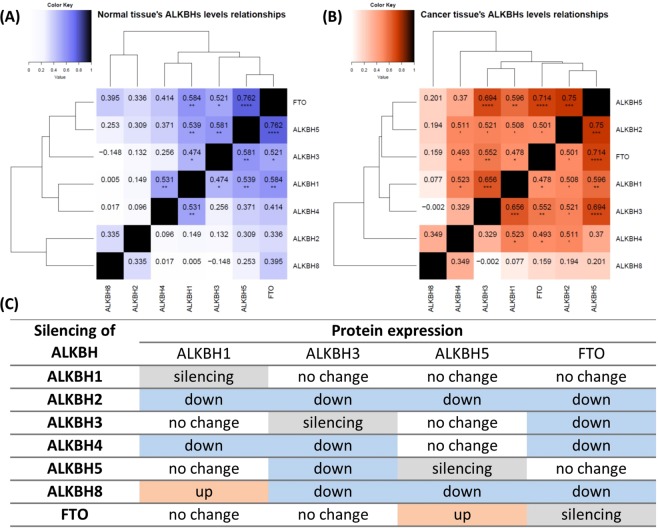
Figure 2.
Relationships between protein levels within ALKBH family members. (A) Relationship between the levels of ALKBH proteins in healthy surrounding tissue and (B) HNSCC tumour. Each tabulated entry presents the Spearman’s rank correlation coefficient and indicates the p-value of correlation. Hierarchical cluster analysis of matrices presents similarities between examined ALKBHs. P-values with Benjamini-Hochberg adjustment: ‘p < 0.005; *p < 0.0025; **p < 0.0005; ***p < 0.00005; ****p < 0.000005. (C) Impact of individual ALKBH protein silencing on expression of its homologs in HeLa. Silencing was done with the use of small interfering RNA, ALKBH protein levels were measured by WB.

