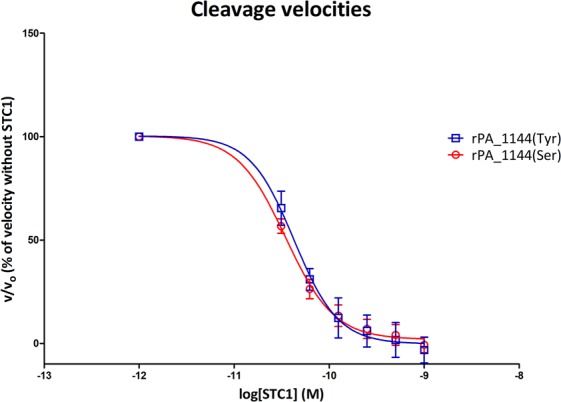
Figure 4.

STC1 inhibition of PAPP-A-mediated IGFBP-4 cleavage. Relative initial velocities (v/v0) of PAPP-A-mediated IGFBP-4 cleavage (mean ± SEM) are plotted against logarithmic values of STC1 (M). Velocities are calculated from 3 time-points (15 min, 30 min, and 45 min) for each rs7020782 variant in the presence of increasing concentrations of STC1 (0.001 nM, 0.0312 nM, 0.0625 nM, 0.125 nM, 0.25 nM, 0.5 nM, and 1.0 nM) relative to the velocity without STC1. Data are fitted to a non-linear regression curve using ‘log(inhibitor) vs. response – variable slope’ in GraphPad Prism 5.0. The serine variant of the rs7020782 SNP is displayed in red and the tyrosine variant in blue. No significant difference was observed.
