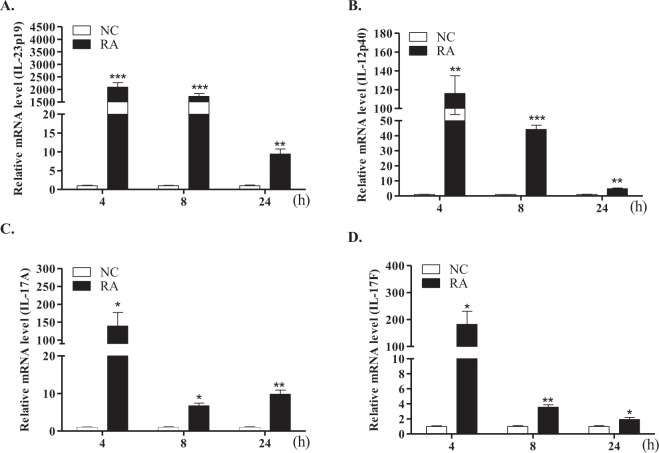
Figure 4.
mRNA expression profiles of IL-23 and Th17 cytokines in duck macrophages. Macrophages were isolated from the spleens of 2-week-old healthy ducks and stimulated with killed R. anatipestifer serotype 7 for the indicated times. Samples were then subjected to qRT-PCR. mRNA expression levels of IL-23p19 (A), IL-12p40 (B), IL-17A (C), and IL-17F (D) were normalized to those of β-actin and calibrated using the expression levels of untreated cultured macrophages (NC). Data are shown as the mean ± SE from three independent experiments performed in triplicate. *P < 0.05, **P < 0.01, and ***P < 0.001. RA, R. anatipestifer-stimulated macrophages.

