Fig. 2.
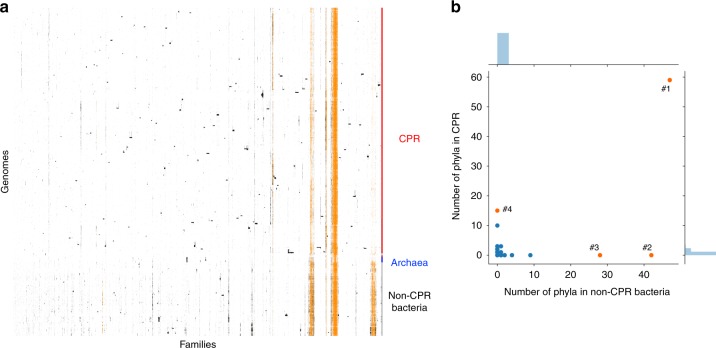
The distribution of the 22,977 families across the 2890 genomes. a The distribution of the 22,977 families (columns) across the 2890 prokaryotic genomes (rows). Data are clustered based on the presence (black)/absence (white) profiles (Jaccard distance, hierarchical clustering using a complete linkage). Archaea: blue, CPR: red, non-CPR bacteria: gray. The patterns in orange correspond to the presence/absence patterns of 921 widespread families. b The phyla distribution of the 235 modules of proteins in CPR (y axis) and non-CPR bacteria (x axis). Each dot corresponds to a module. The orange dots correspond to the four widespread modules on which further analyses focus

