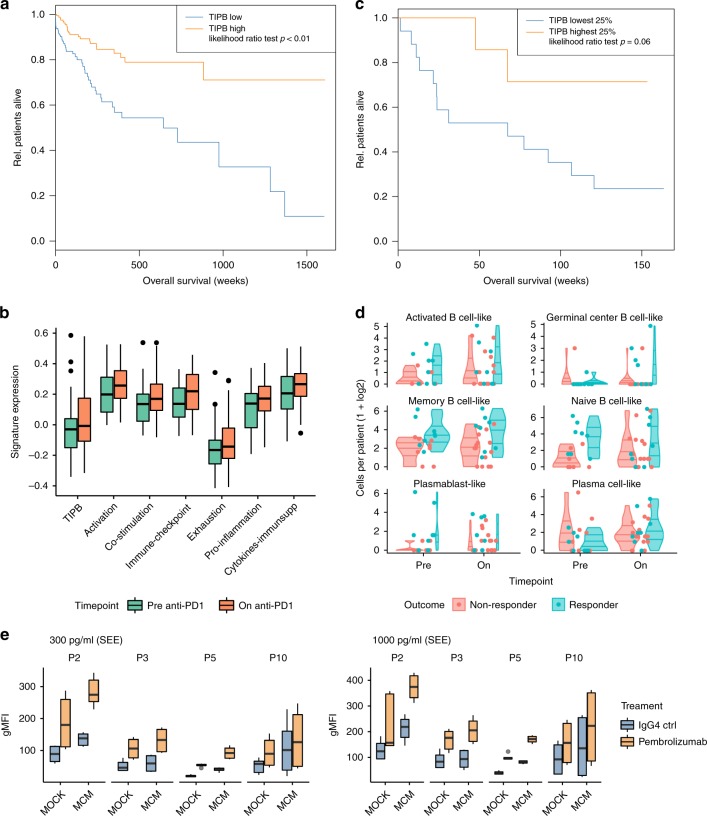
Fig. 4.
TIPB predict improved survival of melanoma patients. a Survival analysis of patients expressing high (orange line) or low levels (blue line) of the TIPB signature separated by the median expression in the TCGA melanoma cohort. b Expression of the TIPB signature and all functional signatures before (green boxes) and on (orange boxes) anti-PD-1 therapy as estimated in the Riaz et al. dataset40. c Survival analysis based on the TIPB signature in the pre-treatment samples comparing top 25% expressing samples (organe line) against the lower 25% samples (blue line) in the Riaz et al. dataset40. d Frequencies of B cell phenotypes (logarithmic scale) before (red) and on (blue) ICB therapy in the scRNA-seq dataset from Sade-Feldman et al. separated by response29. Plots represent the relative frequencies, lines represent the 25%, 50%, and 75% quantiles. e NF-ĸB activity of PD-1-expressing Jurkat T cells co-cultured with control (MOCK) and MCM-conditioned B cells (MCM). Values are shown for control (blue boxes) and Pembrolizumab (orange boxes) treatment. Activation was measured by geo mean fluorescence intensity (gMFI) after stimulation with 300 pg/ml (left panel) and 1 ng/ml (right panel) Staphylococcus Enterotoxin E (SEE). In all boxplots, lower and upper hinges correspond to the first and third quartiles, center line to the median. Upper whisker extends from the hinge to the largest value no further than 1.5 times the interquartile range

