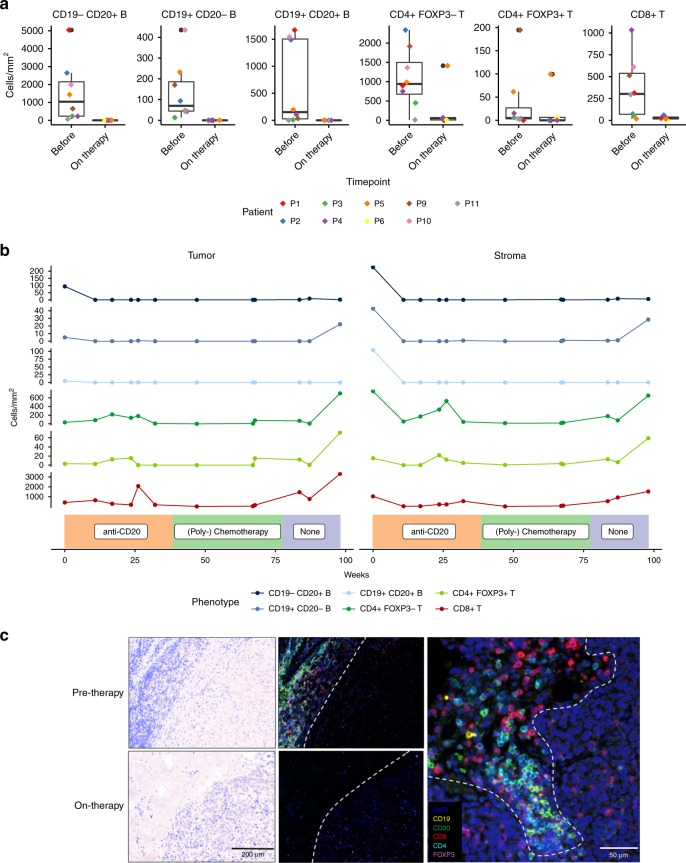
Fig. 6.
Multiplex IHC confirms reduction of CD8+ and CD4+ T cells through B cell depletion. a B- and T cell numbers at the invasive tumor-stroma margin quantified using six-color multiplex immunostaining in tumor samples from nine patients obtained before and on therapy (at week 9 ± 2). Lower and upper hinges correspond to the first and third quartiles, center line to the median. Upper whisker extends from the hinge to the largest value no further than 1.5 times the interquartile range. Other data points are shown as outliers (black circles). Individual patient values are shown through differently colored diamonds. b Longitudinal analysis of tumor samples obtained over nearly 2 years from patient 4. Sample regions were classified as invasive tumor-stroma margin (Stroma) and intratumoral (Tumor). The lowest panel depicts the respective therapy at the given timepoints. Line colors represent the respective cell types. c Multiplex immunostaining for indicated antigens (right) of a representative patient-matched pair of melanoma samples before (top) and on (down) anti-CD20 therapy. Images were taken at the invasive tumor-stroma margin (left: pathology overviews), separated by a dashed line (middle: corresponding immunostaining overviews). Close-up showing a dense B- and T cell infiltrate at the invasive tumor-stroma margin (right). Note loss of B and T cell infiltrates, but not tumor cellularity on therapy (left and middle, down)

