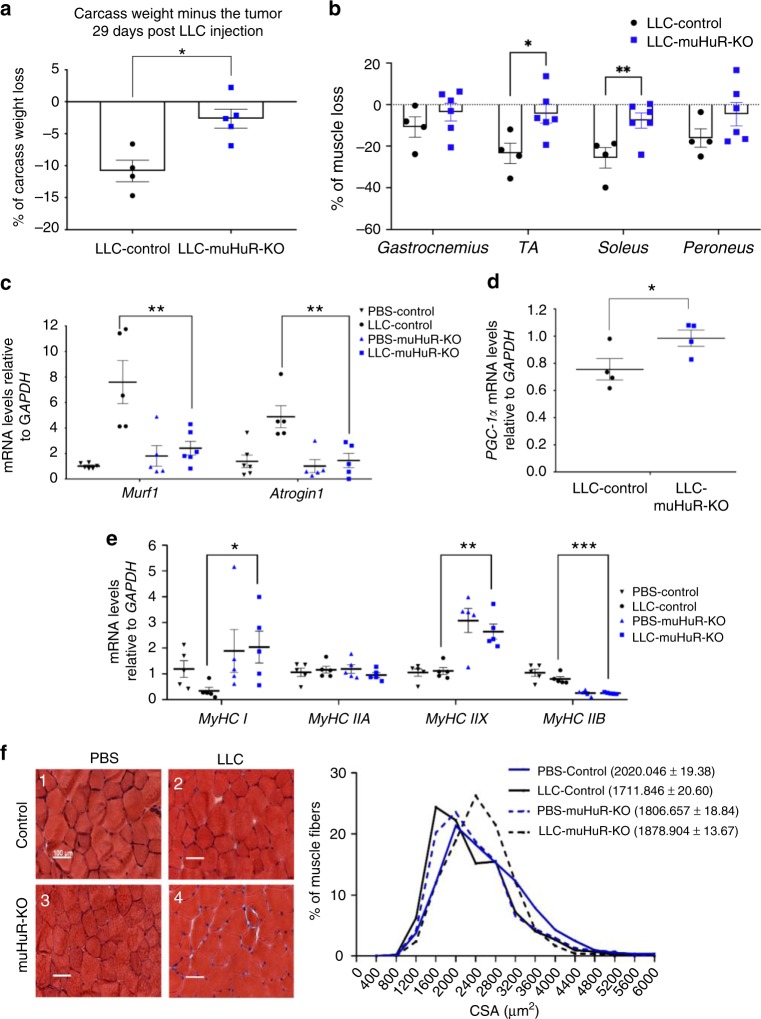
Fig. 8.
HuR ablation in skeletal muscle ameliorates cancer-induced muscle wasting. Muscle atrophy was evaluated in Ctl and muHuR-KO mice using the LLC model of cachexia. a Catabolic wasting was assessed post-mortem on tumor-bearing LLC-Ctl and -muHuR-KO mice by measuring total body weight minus tumor weight. The results are presented as mean ± S.E.M *p < 0.05 unpaired t-test, (LLC-Control n = 4, LLC-muHuR-KO n = 5). b Muscle atrophy was assessed by determining the relative loss of muscle mass in gastrocnemius, TA, soleus, and peroneus muscles from LLC-Control and LLC-muHuR-KO mice. Percentage (%) of muscle loss in both groups is shown relative to non-tumor PBS injected mice from each cohort (LLC-Control n = 4 and LLC-HuR-KO n = 6). c–e Total RNA was isolated from the gastrocnemius muscle of control and muHuR-KO mice bearing or not LLC tumors. Relative mRNA expression levels of Atrogin1 and MuRF1 (c), PGC-1α (d), MyHC I, MyHC IIA, MyHC IIB, and MyHC IIX (e) was assessed by RT-qPCR and mRNA expression levels was determined relative to GAPDH transcript. Expression levels are shown as the fold of induction relative to control-PBS treated mice. (d, n = 4), (c, e, n = 5). f Left panel: representative photomicrographs of gastrocnemius muscles sections from control and muHuR-KO mice taken after H&E staining. Scale bars = 100 μm. Right panel: frequency histogram showing the distribution of muscle fiber CSA in the gastrocnemius muscles from control and muHuR-KO mice bearing or not LLC tumors (n = 4 mice per group). A total of 500 fiber per muscle were used for the CSA analysis. The results are presented as mean ± S.E.M, *p < 0.05, **p < 0.005, ***p < 0.0005 unpaired t-test. Source Data for a, b, c, d, e, and f (right) panels are provided in the Source Data File

