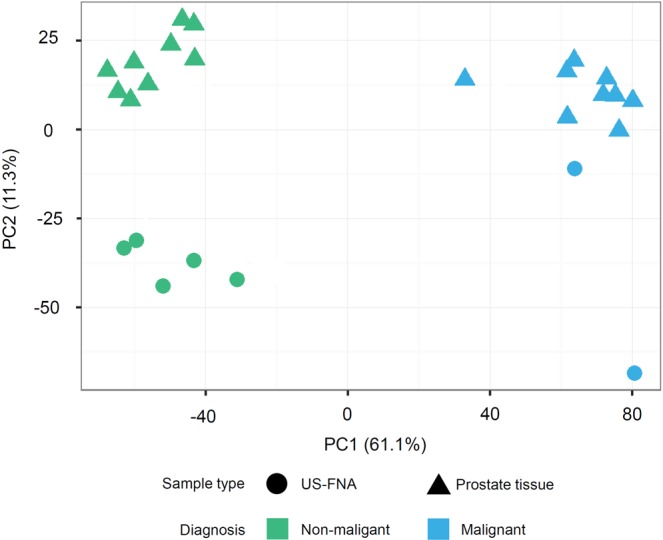
Figure 5.

Principal component analysis (PCA-plot) of differentially expressed genes (DEGs). PCA-plot displays summarised data of 3,587 DEGs in 18 prostate tissues (triangle) and seven US-FNA (circle) samples. In general, variances between samples on the x-axis (principal component 1, PC1) separated the data the most (61.1%) and are associated with diagnosis: non-malignant (green) and malignant (blue) samples. Variances on y-axis were lower with 11.3% (principal component 2, PC2) and related to different sampling techniques.
