Fig. 1.
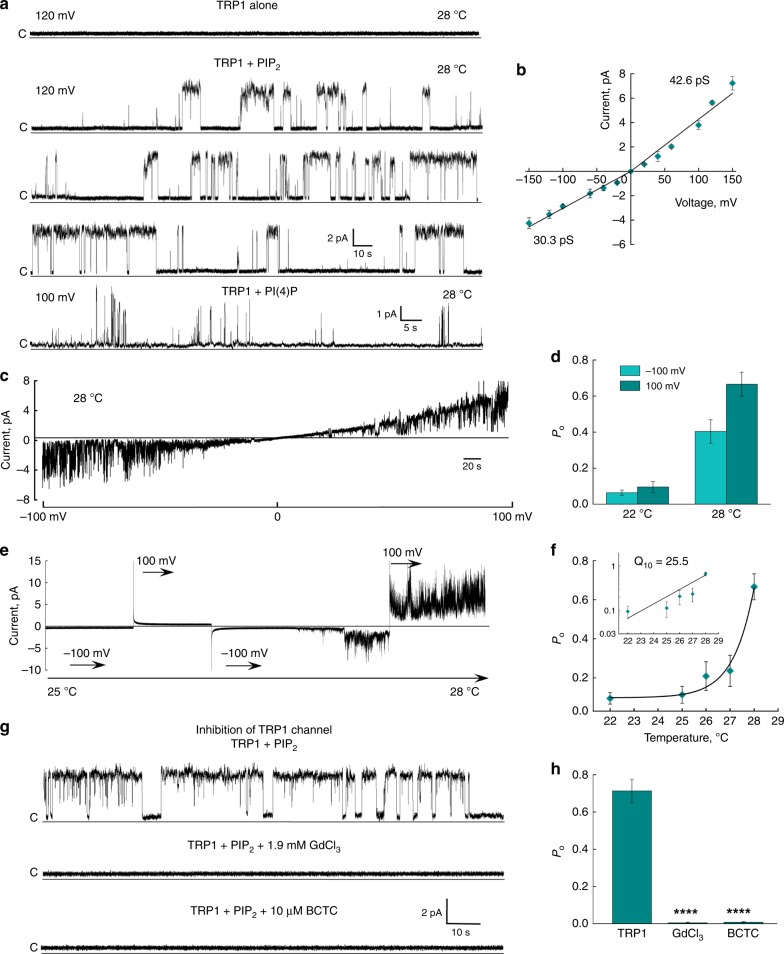
Functional characterization of crTRP1. a Representative single-channel recordings of crTRP1 currents obtained in the absence of phosphoinositides or in the presence of 2.5 µM PIP2 at 28 °C and +120 mV (n = 5; the number of events analyzed (NE) = 2538) or PI(4)P at 28 °C and +100 mV (n = 3; NE = 650). b Current–voltage (I–V) relationship for crTRP1 activity evoked by 2.5 µM PIP2 at 28 °C. The data represent 15 independent experiments, NE = 114,629. c Representative single-channel traces obtained from voltage ramps of −100 to +100 mV (representative of n = 8). d crTRP1 channel open probability (Po) obtained at 22 and 28 °C, and two different voltages, −100 and +100 mV (n = 18; NE = 192,809). e Representative crTRP1 current traces obtained in the presence of 2.5 µM PIP2 in response to a temperature increase from 22 to 28 °C, at −100 and +100 mV (representative of n = 15). f Temperature dependence of Po in the presence of 2.5 µM PIP2, obtained at +100 mV (n = 12; NE = 67,673). Insert, Q10 was estimated from the regression slope of temperature dependent changes in Po, Q10 = 25.5 ± 1.2. g Representative crTRP1 current traces recorded at 28 °C, +120 mV, and 2.5 µM PIP2 (upper traces), in the presence of 1.9 mM GdCl3 (middle traces), or 10 µM BCTC (lower traces). h Summary of crTRP1 inhibition by 1.9 mM GdCl3 or 10 µM BCTC (n = 3 for each inhibitor, NE = 8,560; difference in Po values was calculated using One-way ANOVA, p = 1.6 × 10⁻⁵ for the control vs. GdCl3, and p = 1.7 × 10⁻⁵ for the control vs. BCTC). All data are presented as mean ± SEM. Source data are provided as a Source Data file

