Fig. 2.
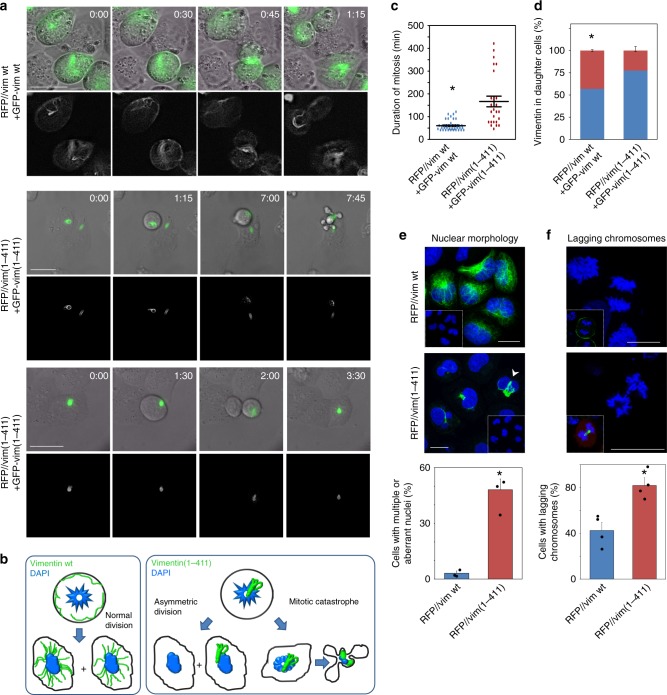
Monitorization of cells expressing vimentin wt or vimentin(1-411) during mitosis. a SW13/cl.2 cells were transfected with RFP//vimentin wt plus a tracer amount of GFP-vimentin wt, or the equivalent constructs for vimentin(1-411), as indicated, for live cell monitoring by time-lapse microscopy. Several fields were randomly selected and images were acquired every 15 min. Representative images of the overlays of DIC and vimentin green fluorescence (upper panels) and green fluorescence only (lower panels, in gray scale), at the indicated time points, are shown. Scale bars, 20 μm. b Schematic representation of the main fates observed for cells transfected with each construct. c Duration of mitosis from cell rounding to separation of daughter cells (* p < 10−6). d The proportion of vimentin signal present in each daughter cell is presented in different colors (*p < 10−5). e SW13/cl.2 cells were transfected with RFP//vim wt or (1-411). Nuclear morphology was assessed by DAPI staining and vimentin distribution by immunofluorescence. The percentage of cells showing multiple or aberrant nuclei (arrowheads) is depicted in the lower graph (*p < 0.002). f SW13/cl.2 cells, transfected as in e, were synchronized by mild nocodazole treatment. Cells in anaphase were monitored 100 min after nocodazole removal and the proportion of cells showing lagging chromosomes, assessed by DAPI staining, is depicted in the lower graph (*p < 0.01). The number of determinations for the experimental conditions shown in graphs from left to right was the following: c 38, 25; d 24, 16; e 3 totaling 336 cells, 3 totaling 219 cells; f 4 totaling 96 cells, 4 totaling 64 cells. Average values ± SEM are shown. All p values were obtained with two-tailed, unpaired Student’s t-test and original datasets are provided as Source Data file

