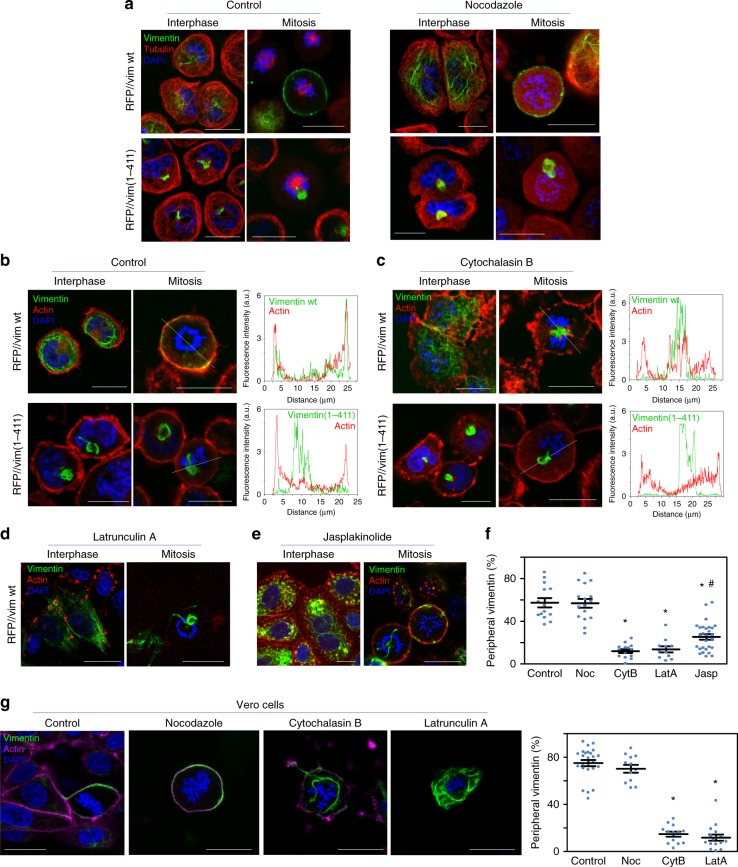
Fig. 3.
Effect of microtubule or actin filament disruption on the distribution of vimentin wt and vimentin(1-411). a–d The distribution of vimentin and tubulin or f-actin was assessed in interphase and mitotic cells. a SW13/cl.2 cells transfected with RFP//vimentin wt or (1-411) to express untagged vimentin proteins, were treated in the absence or presence of 5 µM nocodazole for 30 min in serum-free medium. Vimentin (green) and tubulin (red) were visualized by immunofluorescence. b, c SW13/cl.2 cells were transfected as above, cultured in the absence b or presence c of 10 µg/ml cytochalasin B for 30 min in serum-free medium. Vimentin (green) was visualized by immunofluorescence and f-actin was stained with Phalloidin (red). Fluorescence intensity profiles of vimentin and actin along the dotted lines are shown in the right panels. d–f SW13/cl.2 cells transfected with RFP//vimentin wt were treated in serum-free medium with 2.5 µM latrunculin A d or 50 nM jasplakinolide e for 30 min, and processed by immunofluorescence. Representative images of single sections taken at mid-height of interphase and dividing cells are shown. f Quantification of the proportion of vimentin located at the cell periphery upon disruption of microtubules or actin. Noc nocodazole; CytB cytochalasin B; LatA latrunculin A; Jasp jasplakinolide (*p < 10−7 vs. control; #p < 0.02 vs. CytB and LatA). h Vero cells were treated with the indicated agents and the distribution of endogenous vimentin and actin in mitotic cells was assessed as above. Graph shows the proportion of vimentin associated with the cell periphery (*p < 0.001 vs. control). The number of determinations for the experimental conditions shown in graphs from left to right was the following: f 14, 16, 14, 11, 28; g 25, 12, 13, 16. Average values ± SEM are shown. All p-values were obtained with two-tailed, unpaired Student’s t-test. Data are available in the Source Data file. Scale bars, 20 μm

