Fig. 5.
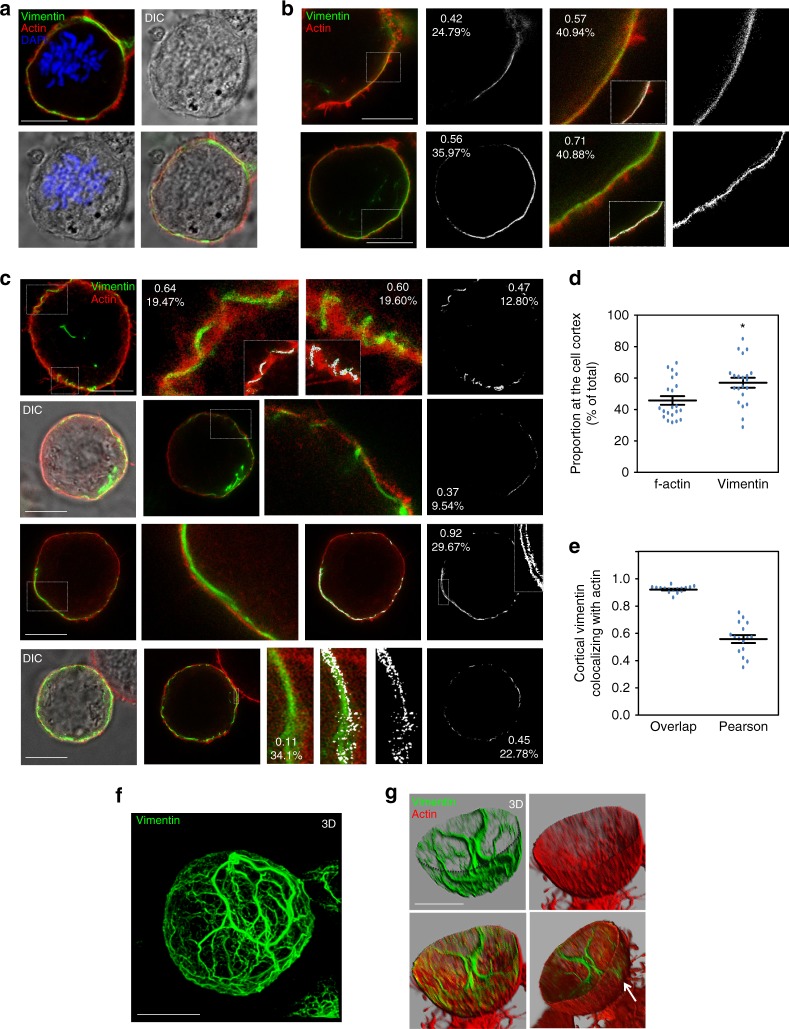
Analysis of the relative positions of vimentin and actin in mitosis by STED superresolution microscopy. a Confocal microscopy images illustrating the identification of mitotic Vero cells by the typical aspect of dividing chromosomes in DIC, confirmed by DAPI staining in merged images. The distribution of f-actin and vimentin was monitored by TRITC-phalloidin staining and immunofluorescence with Alexa488-conjugated V9 antibody, respectively. b Mitotic Vero cells, identified by DIC visualization, were analyzed by STED and images of several cells are shown. Colocalization masks (shown in white) or enlargements of areas delimited by dashed rectangles are shown to the right. Co-localization analysis was performed with Leica software. Numbers in insets represent the Pearson’s coefficient and the percentage of co-localization for the regions shown. c SW13/cl.2 cells stably transfected with RFP//vimentin wt were treated with 0.4 µM nocodazole overnight, to increase the proportion of mitotic cells. Vimentin and f-actin were detected as above. STED images of several cells are shown. Overlays with DIC images are confocal images. Colocalization masks (white) or enlargements of areas delimited by dashed rectangles are shown to the right. Numbers in images represent the Pearson’s coefficient and the percentage of co-localization, respectively, for the whole cell or for the regions enlarged. d Proportion of f-actin or vimentin located at the cell periphery (n = 21, *p < 0.02 by two-tailed, unpaired Student’s t-test). e Colocalization of cortical vimentin with f-actin analyzed by calculation of overlap and Pearson coefficients for the cortical ROI (n = 16). Datasets for d and e are provided in the Source Data file. Average values ± SEM are shown. f 3D-reconstruction of vimentin organization, after deconvolution of the green channel using Imaris software, for one representative cell treated as in c. g 3D-reconstruction using the basal half of the sections from the same cell in order to show the inside and the outside of the sphere. Single channels (upper panels) and merged images (lower panels) are shown. The semi-sphere edge is marked in the green channel (dotted line). The bottom-right image is a snapshot of Supplementary Movie 5. The arrow points at a protrusion of vimentin through the actin cortex. Scale bars, 10 μm

