Fig. 7.
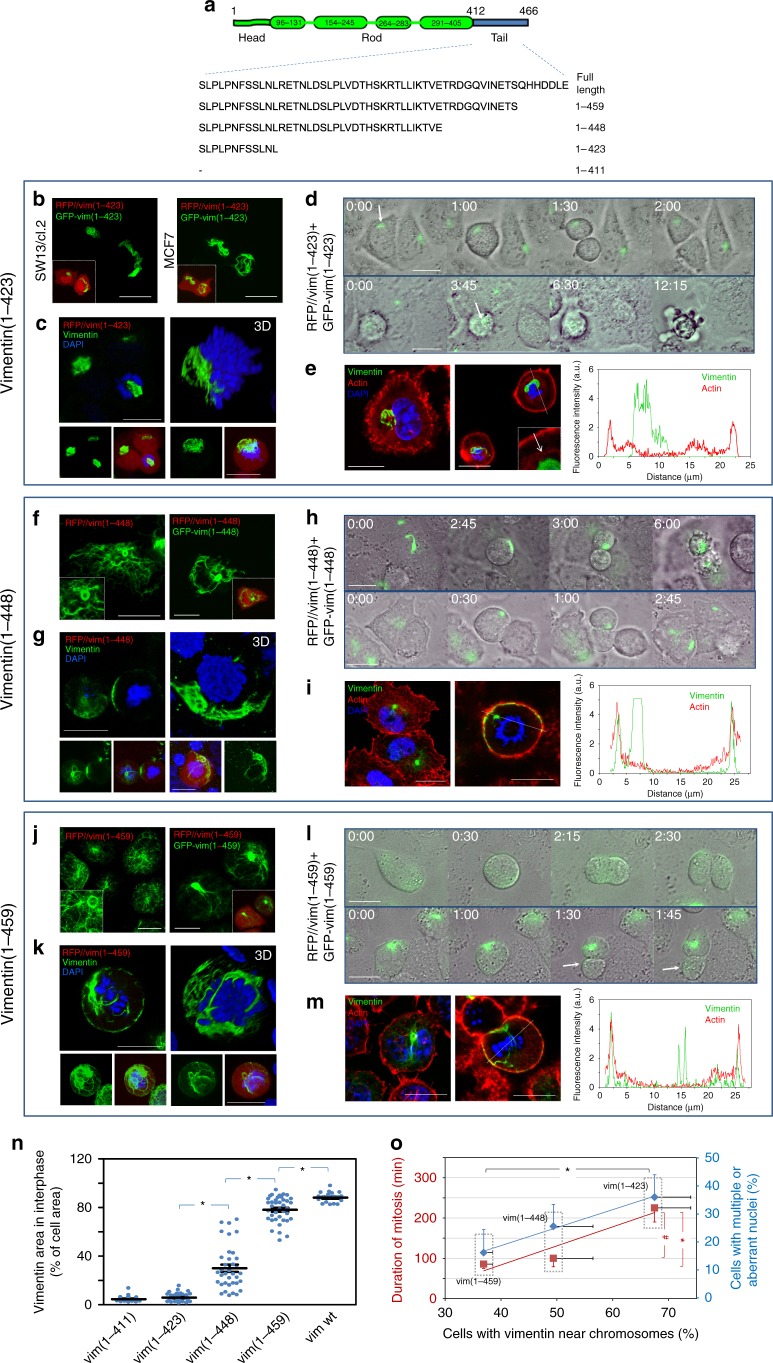
Organization and mitotic distribution of several C-terminal truncated vimentin mutants. a Scheme of truncated vimentin mutants. b Overall projections of live SW13/cl.2 or MCF7 cells transfected with RFP//vimentin(1-423) plus GFP-vimentin(1-423). Insets, merged channels showing RFP fluorescence to delimit the cell contour. c Immunofluorescence of SW13/cl.2 cells transfected with RFP//vimentin(1-423), illustrating truncated vimentin distribution in mitosis; left image, single section at mid-cell height; right image, 3D-projection; lower panels, overall projections of vimentin alone (green) or overlays of vimentin, DAPI and RFP fluorescence. d Live cells transfected with RFP//vimentin(1-423) plus GFP-vimentin(1-423) monitored by time-lapse microscopy, illustrating asymmetric partition (upper panels) and mitotic catastrophe (lower panels). e Cells were transfected as in c and vimentin and f- actin distributions monitored in interphase (left image) and mitosis (right image; arrow, cytoplasmic f-actin); right panel, vimentin and f-actin fluorescence intensity along the dotted line in the mitotic cell. f and j SW13/cl.2 cells were transfected with RFP//vimentin(1-448) in f, or RFP//vimentin(1-459) in j, alone or alongside the corresponding GFP-fusion construct, as indicated; left panels, vimentin immunofluorescence; right panels, vimentin visualization in live cells. g and k Cells transfected with RFP//vimentin(1-448) in g, or RFP//vimentin(1-459) in k were analyzed as in c. h Time-lapse monitoring of RFP//vimentin(1-448)-transfected cells illustrating mitotic failure (upper sequence) and asymmetric division (lower sequence). l Monitorization of RFP//vimentin(1-459)-transfected cells undergoing normal (upper panel) or asymmetric division (lower panel; arrow, vimentin vestige). i and m Vimentin and f-actin distribution in resting and mitotic RFP//vimentin(1-448)- (i) or RFP//vimentin(1-459)-(m) transfected cells, as described for e. n Ability of vimentin constructs to form an extended network in interphase, quantitated as percentage of cell area covered by vimentin (*p < 0.001). o Correlation between the proportion of cells with vimentin near dividing chromosomes (x-axis) for each vimentin-truncated mutant and the corresponding mitosis duration (left y-axis, red labels, y = 4.7251x − 105.33; R2 = 0.899) or the proportion of cells showing multiple/aberrant nuclei (right y-axis, blue labels, y = 4.4633x− 47.031; R2 = 0.994) (*p < 0.01; #p < 0.02). The number of determinations for the experimental conditions shown in graphs from left to right was the following: n 22, 26, 36, 39, 20 o duration of mitosis, 17, 15, 30; vimentin near chromosomes, three determinations totaling 51, 55, and 51 cells; cells with multiple or aberrant nuclei, three determinations totaling 155, 206, and 151 cells. Average values ± SEM are shown. All p values were obtained by two-tailed, unpaired Student’s t-test. Scale bars, 20 μm. Data are available in the Source Data file

