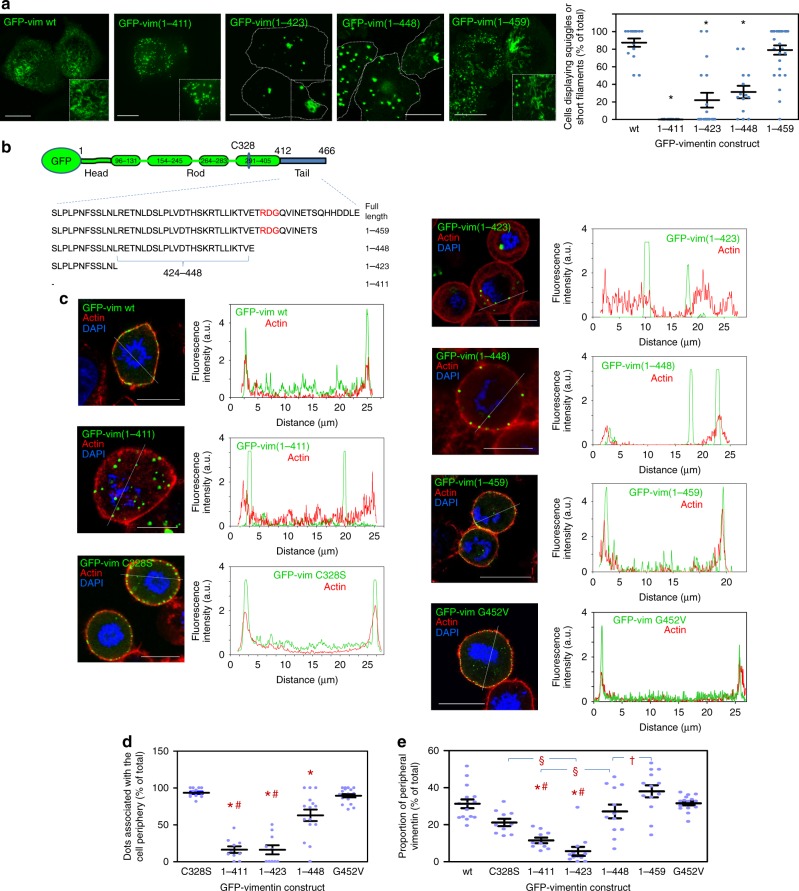
Fig. 8.
Assembly and distribution of GFP fusion constructs of truncated vimentin forms. a Live confocal microscopy assessment of the morphology of vimentin assemblies 48 h after transfection of SW13/cl.2 cells with the constructs schematized in panel b. Overall projections are shown. Insets show enlarged areas of interest. The graph (right) depicts the percentage of cells with squiggles or short filaments for every construct (*p < 10−6 vs. wt) by two-tailed, unpaired Student’s t-test. c Cells were transfected with the indicated constructs, treated overnight with 0.4 µM nocodazole in complete medium to increase the proportion of mitotic cells, fixed, and the distribution of vimentin and f-actin in mitotic cells, assessed. Nuclei were counterstained with DAPI. Single sections taken at mid-cell height are shown in all cases. For every condition, fluorescence intensity profiles for vimentin and f-actin along the dotted lines are shown on the right. d Proportion of vimentin dots associated with the cell periphery for every construct. In this case, GFP-vimentin C328S, which contains an intact tail domain but assembles in dots, is used as a control. GFP-vimentin(1-459) is excluded from this graph due to its organization mainly in squiggles or short filaments (*p < 0.001 vs. GFP-vimentin C328S and GFP-vimentin G452V; #p < 0.001 vs. GFP-vimentin(1-448) by ANOVA followed by Tukey’s post-test for multiple comparisons). e Proportion of peripheral vimentin for all constructs (*p < 0.001 vs. GFP-vimentin wt; §p < 0.01; #p < 0.01 vs GFP-vimentin(1-448) and (1-459); †p < 0.05 by ANOVA followed by Tukey’s post-test). The number of determinations for the experimental conditions shown in graphs from left to right was the following: a 15, 15, 18, 20 and 28 fields, totaling 162, 55, 77, 97 and 142 cells, respectively; d 12, 10, 10, 15, 19; e 15, 10, 10, 12, 12, 13, 20. Average values ± SEM are shown. Data are provided in the Source Data file. Scale bars, 20 μm

