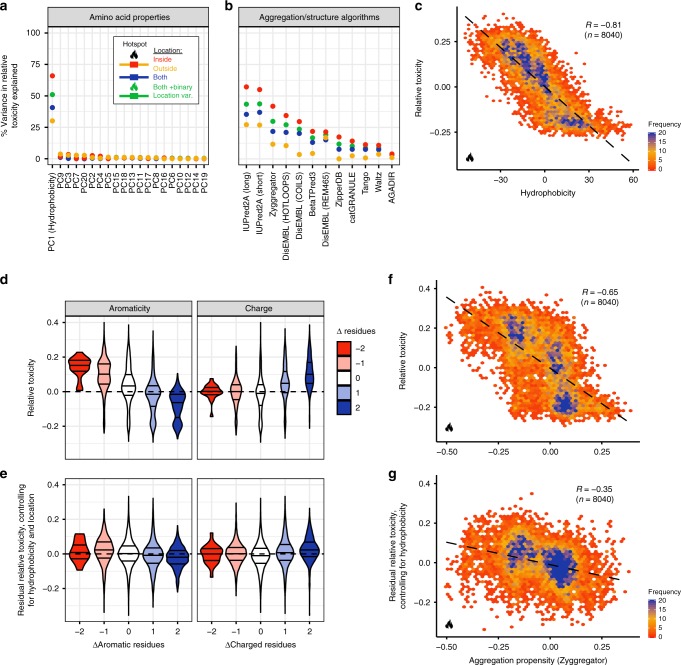
Fig. 2.
Changes in hydrophobicity are highly predictive of TDP-43 cellular toxicity. a Percentage variance of toxicity explained by linear regression models predicting single and double mutant variant toxicity from changes in AA properties upon mutation (PCs, principal components of a collection of AA physico-chemical properties). Different regression models were built for different subsets of the data. Simple linear regression models for all variants (blue) or only variants inside (red) or outside (yellow) the hotspot region. And a regression model using all variants and including a binary location variable (inside/outside hotspot) as well as an interaction term between binary location variable and the indicated AA property feature (green). b Percentage variance of toxicity explained by linear regression models predicting variant toxicity using scores from aggregation/structure algorithms (see Methods). Colour key shown in panel (a). See also Supplementary Fig. 4. c Toxicity of variants with single or double mutations within the hotspot region as a function of hydrophobicity changes (PC1) induced by mutation. The Pearson correlation (R) before binning is indicated. See also Supplementary Fig. 9a. d Toxicity distributions of single and double mutants stratified by the change in the number of aromatic (H,F,W,Y,V) or charged residues (R,D,E,K) relative to the WT sequence. Horizontal axis as in panel (e). e Distribution of residual toxicity after controlling for the effect of hydrophobicity and location on toxicity (green regression model in panel a) stratified by the number of aromatic (H,F,W,Y,V) or charged (R,D,E,K) AAs. f Single and double mutant variant toxicity as a function of changes in aggregation propensity (Zyggregator). Only variants occurring within the toxicity hotspot are depicted. The Pearson correlation (R) before binning is indicated. g Toxicity as a function of aggregation propensity after controlling for hydrophobicity (red regression model in panel a). Only variants occurring within the toxicity hotspot are depicted. The Pearson correlation (R) before binning is indicated. See also Supplementary Fig. 9b

