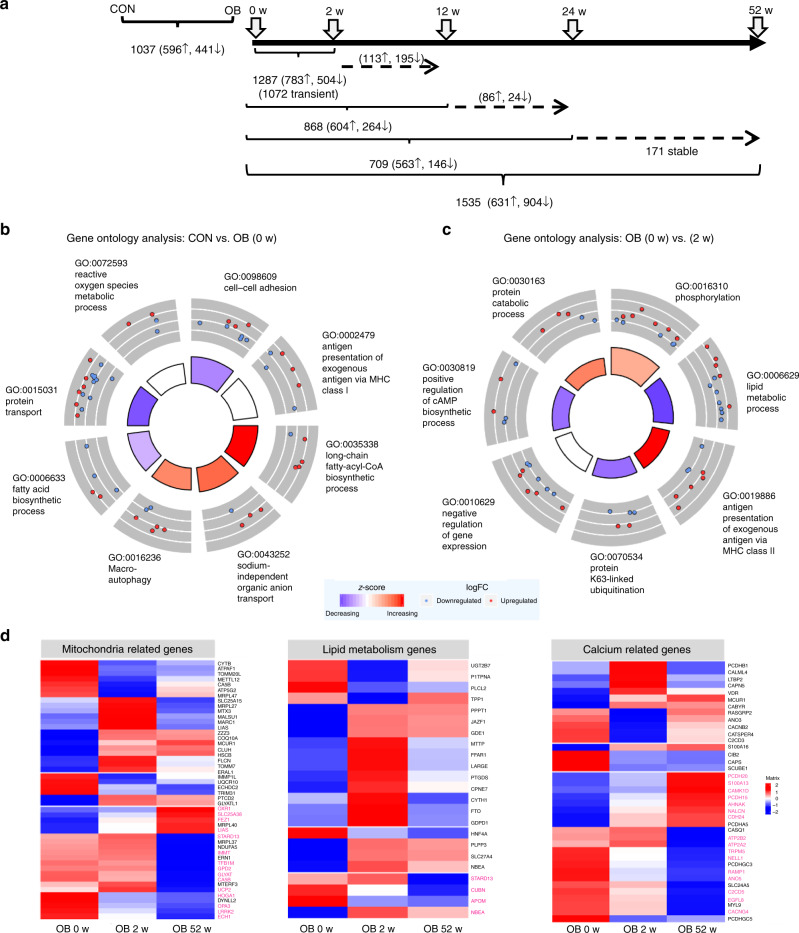
Fig. 3.
Differences in skeletal muscle transcriptome. Transcriptome analysis of skeletal muscle before (0 weeks), at 2, 12, 24 and 52 weeks after metabolic surgery. Data are given as number of differentially expressed transcripts between indicated groups and time points (a). Gene ontology analysis of genes differentially expressed between lean (CON) and obese (OB) participants. The inner circle depicts the main processes to be increased (blue) or decreased (red) in OB. The outer circle shows scaled scatter plots for affected genes and their regulation within the most-enriched biological pathway in OB at baseline (OB, 0 w) (b) and 2 weeks after the surgery (OB, 2 w) (c). Changes in mRNA expression of genes related to mitochondrial function, lipid metabolism and calcium signaling in skeletal muscle (d). Heat maps indicate expression levels of listed genes at 0 (baseline), 2 and 52 weeks after metabolic surgery. Each column represents the average expression level of 16 individuals and each row shows the expression profile of one single transcript with significant differences. Up- and downregulated genes are indicated by red and blue signals, respectively; the signal intensity corresponds to the log-transformed magnitude of the average of expression per group. All genes printed in bold magenta show differentially methylated CpGs at 52 weeks. For gene expression unadjusted p-value and DNA methylation data are adjusted for multiple testing with Benjamini Hochberg correction *p < 0.05 (unpaired (CON vs OB) and paired (OB 0 vs 2 weeks/52 weeks two-tailed t-test; CON: n = 6, OB: n = 16)

