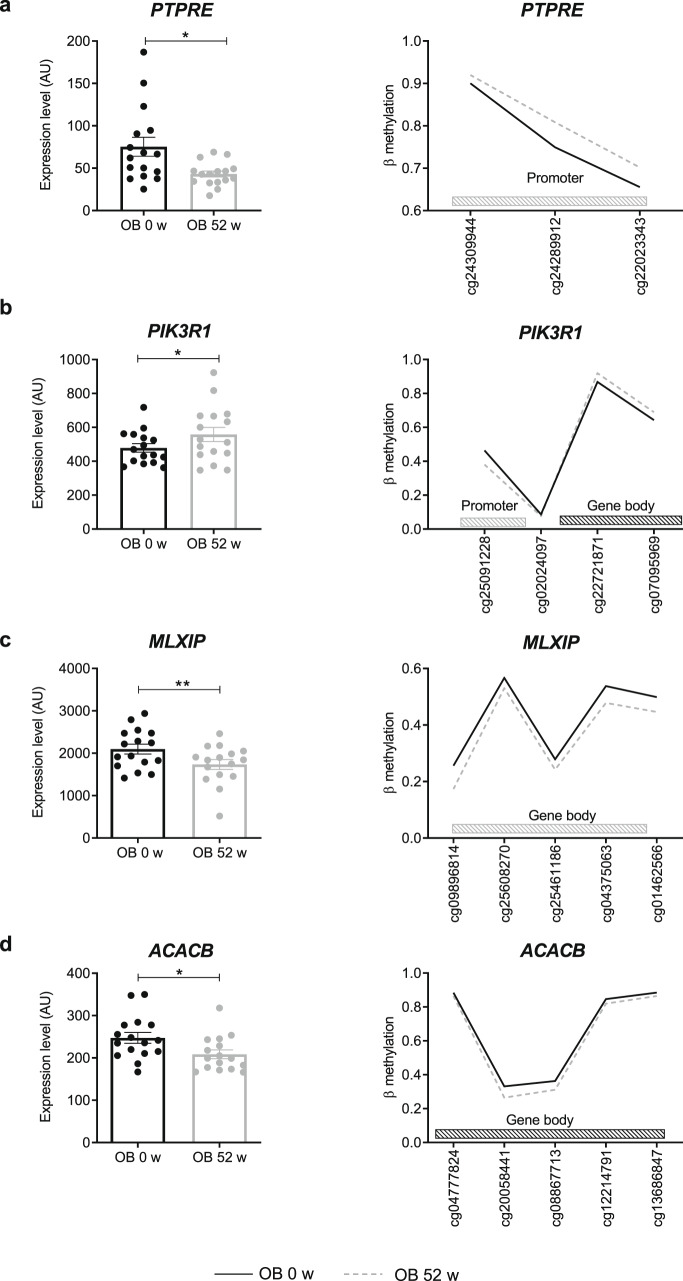
Fig. 5.
Gene candidates showing differences in expression and DNA methylation. Expression is shown in left panels and levels of DNA methylation in right panels. Differentially methylated CpGs are located at different positions of the genes, either in the promoter as shown for PTPRE (a), in the gene body as shown for MLXIP (c) and ACACB (d), or in both as depicted in PIK3R1 (b). Mean ± SEM (left panels). Obese humans given as black circles/lines at baseline and as gray circles/lines at 52 weeks. Only significantly differentially methylated CpGs are represented; *p < 0.05 (Gene expression unadjusted p-value paired t test, n = 16, methylation data with Benjamini Hochberg correction)

