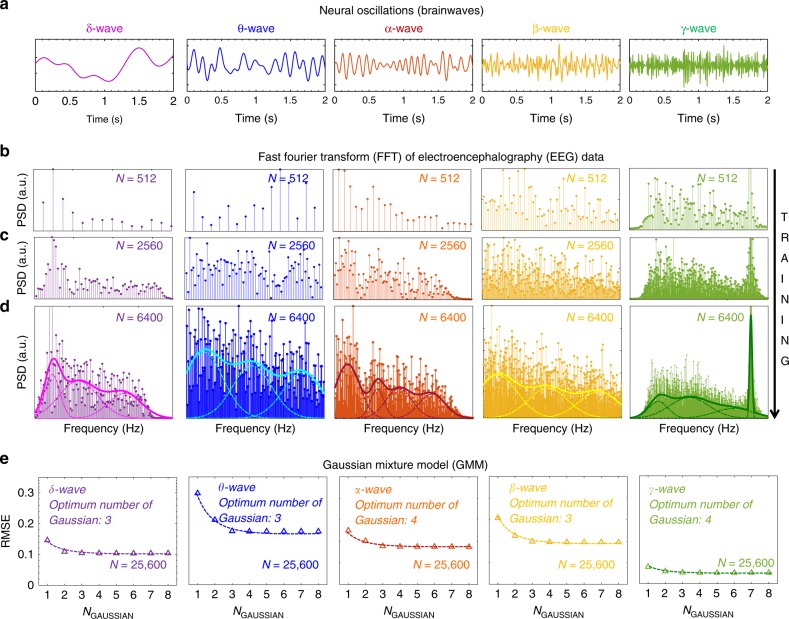
Fig. 4.
Recognition of Brainwaves using Gaussian Mixture Model (GMM). a Brainwaves are divided into five frequency bands. 0.5–3.5 Hz: Delta waves (δ), 4–8 Hz: Theta waves (θ), 8–14 Hz: Alpha waves (α), 16–32 Hz: Beta waves (β) and 32–64 Hz: Gamma waves (γ). Normalized power spectral density (PSD) as a function of frequency for each type of brainwaves, extracted using the Fast Fourier Transform (FFT) of the time domain Electroencephalography (EEG) data (sequential montage) with increasing sampling times that correspond to sample sizes of (b) N = 512, (c) N = 2560, and (d) N = 6400. As the training set becomes more and more exhaustive, the discrete frequency responses evolve into continuous spectrums. The highly nonlinear functional dependence of the PSDs on frequency for each type of brainwave can be classified using GMM, which is represented as the weighted sum of a finite number of scaled (different variance) and shifted (different mean) normal distributions. e Root mean square error (RMSE) as a function of K, i.e., the number of Gaussian used in the GMMs for each type of brainwave. Clearly, a very limited number of Gaussian synapses are necessary to capture the non-linear decision boundaries

