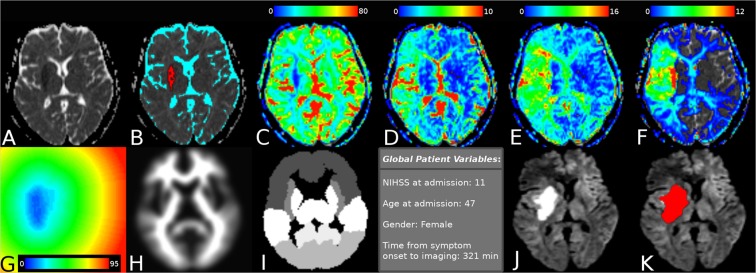
Figure 1.
Maps of voxel features extracted in the preprocessing step. Panel (A) shows a selected ADC slice, with (B) superimposing the automatic segmentation of infarct core (red) and CSF (cyan). Also shown are: (C) CBF visualized from 0 to 80 mL/min/100 g; (D) CBV visualized from 0 to 10 mL/100 g; (E) MTT visualized from 0 to 16 seconds; (F) Tmax visualized from 0 to 12 seconds; (G) distance from infarct core visualized from 0 to 95 voxels; (H) the registered MNI white-matter atlas; (I) the discrete MNI brain atlas regions; and (J) follow-up imaging with the segmented real tissue outcome superimposed in (K).

