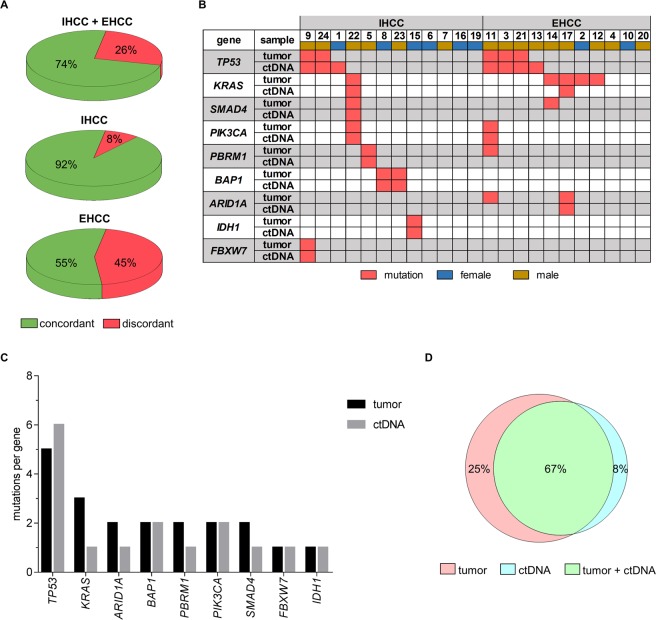
Figure 2.
Mutational profile of therapy naive cholangiocarcinoma patients assessed by targeted resequencing analysis of tumor tissue and ctDNA and concordance of mutations detected in tumor tissue and ctDNA of therapy naive cholangiocarcinoma patients. (A) Proportion of patients with identical mutational profile in tumor tissue and ctDNA. Data are shown for the entire cohort (top) and grouped by tumor localization, for IHCCs (middle) and for EHCCs only (bottom). (B) Detailed mutational profile per patient. Patients were sorted by mutation frequency per gene and separated according to primary tumor localization. Only genes with detected mutations are shown here. (C) Number of total unique variants identified per gene. No statistical difference in the mean number of unique variants between tumor and ctDNA (P = 0.3125, Wilcoxon) or between IHCC and EHCC patients (tumor p > 0.9999, Wilcoxon; ctDNA P = 0.3594, Wilcoxon). (D) Venn diagram showing the overlap between ctDNA and tumor biopsy sequencing analysis for every mutation reported. IHCC - intrahepatic cholangiocarcinoma; EHCC - extrahepatic cholangiocarcinoma.

