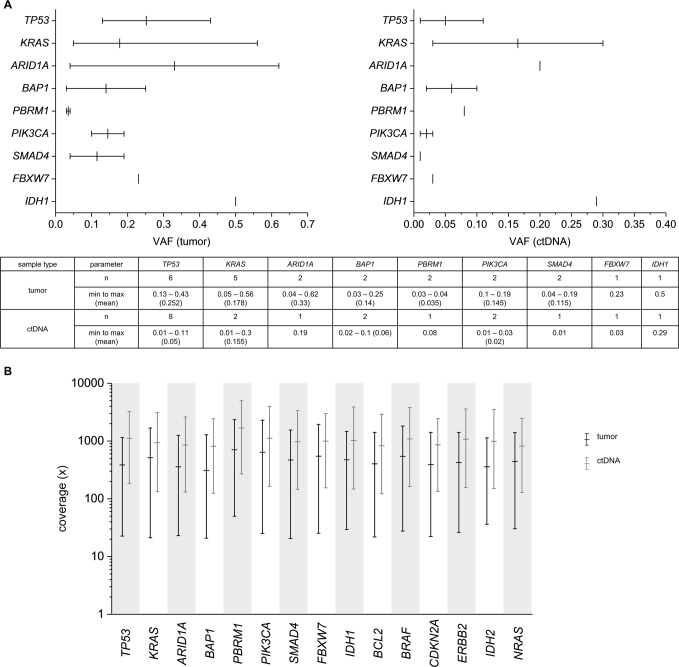
Figure 3.
Variant allele frequencies (VAF) and sequencing depth in tumor tissue and ctDNA. (A) VAFs of all detected variants per gene in tumor tissue (left) and ctDNA (right). Bars indicate range of mutated allele fraction (min, max, mean). (B) Coverage statistics per gene across all samples for tumor tissue and ctDNA. Mean total coverage is significantly higher for ctDNA samples (1010x) than for tumor tissue samples (465x; p < 0.0001, Mann-Whitney). Bars indicate range of mutated allele fraction (min, max, mean).

