Fig. 2.
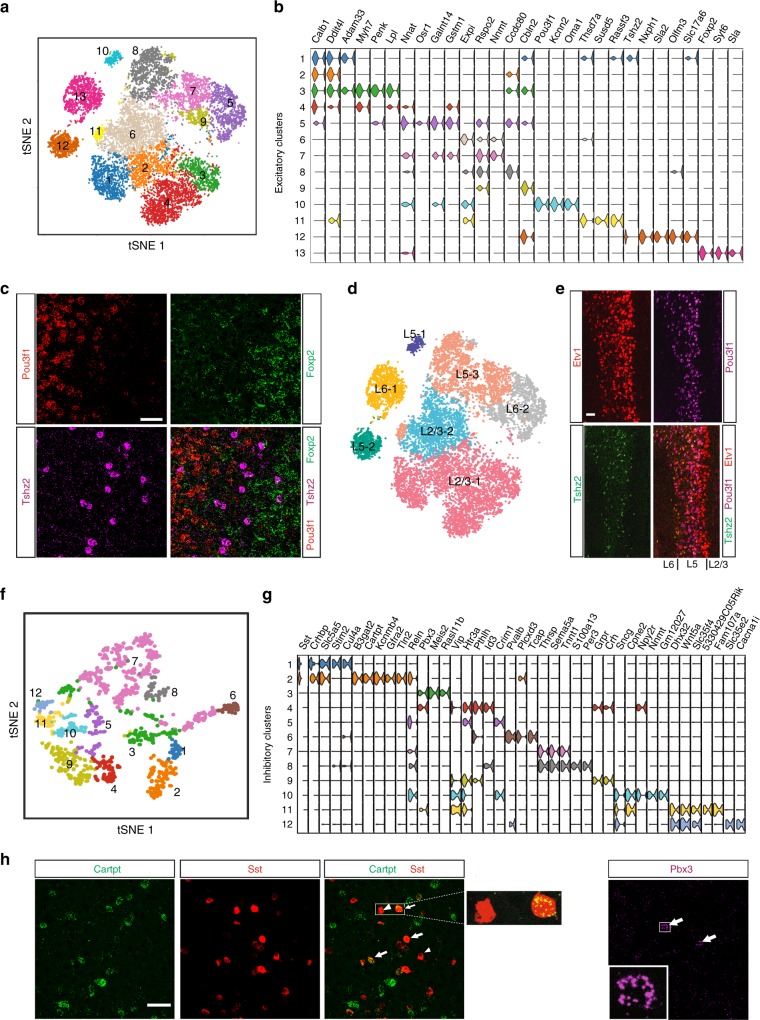
PFC contains distinct excitatory and inhibitory neuron subtypes. a t-SNE plot showing that excitatory neurons of PFC can be broadly classified into 13 unique subtypes based on their transcriptome. b Violin plot showing expression of specific markers for each of the 13 excitatory neuron clusters or subtypes. c Multi-channel FISH detecting distinct excitatory neuron types within the same cortical layer (Pou3f1 and Tshz2 in L5) or across different layers (Foxp2 in L6). d Assigning excitatory neurons to respective cortical layers by projecting expression of layer-specific markers onto the t-SNE plot. e Identification of two distinct cell types (Pou3f1+ and Tshz2+) in L5 that commonly express L5 marker Etv1. f t-SNE plot showing classification of PFC inhibitory neurons into 12 distinct subtypes based on their transcriptome. g Violin plot showing distinct markers for each of the 12 different subtypes of inhibitory neurons. h Multi-channel FISH detecting subtypes within a known inhibitory neuron subpopulation (Cartpt+, arrow, and Cartpt−, arrowhead within Sst neurons: enlarged view of single cells in box area shown in side panel) and a rare neuron subtypes (Pbx3+: inset is an enlarged view of single cell)

