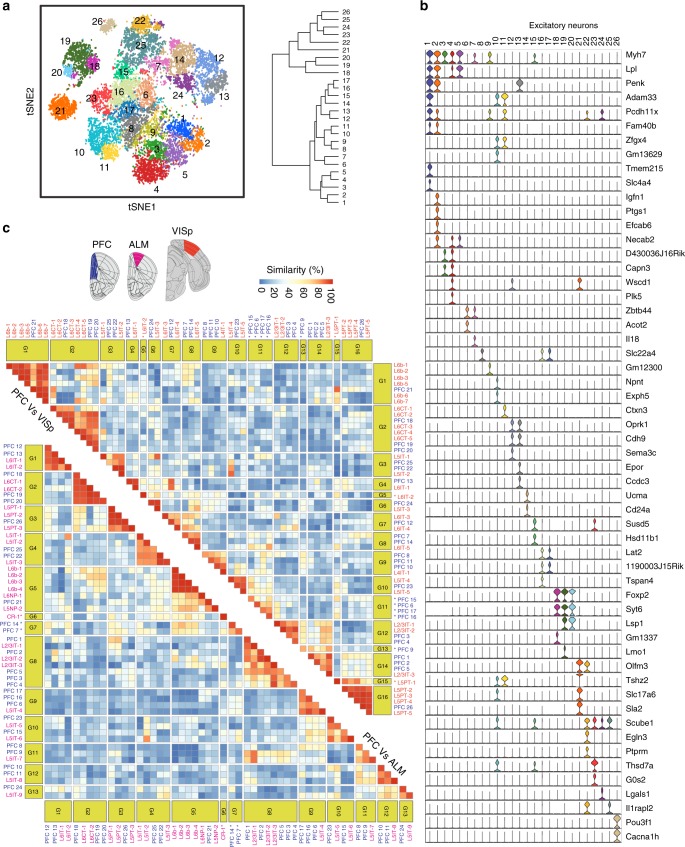
Fig. 3.
Distinct transcriptional features of PFC excitatory neurons relative to those of VISp and ALM. a t-SNE plot (left) showing high resolution clustering of PFC excitatory neurons and the dendrogram of hierarchical clustering (right). b Violin plot showing the distinct markers for each of the clusters in a. c Heat map showing the degree of similarity [0–100] between the excitatory neuron subtypes in PFC, primary visual cortex (VISp), and anterolateral motor (ALM) based on similarity of transcriptional profiles. Subtypes showing a similarity ≥ 90% were clustered together into blocks. Subpopulations showing <90% similarity to any of the subpopulation from the other dataset were considered as region specific (shown with bold font and *). VISp and ALM cluster names were abbreviated, the original corresponding names are available in Supplementary Data 3

