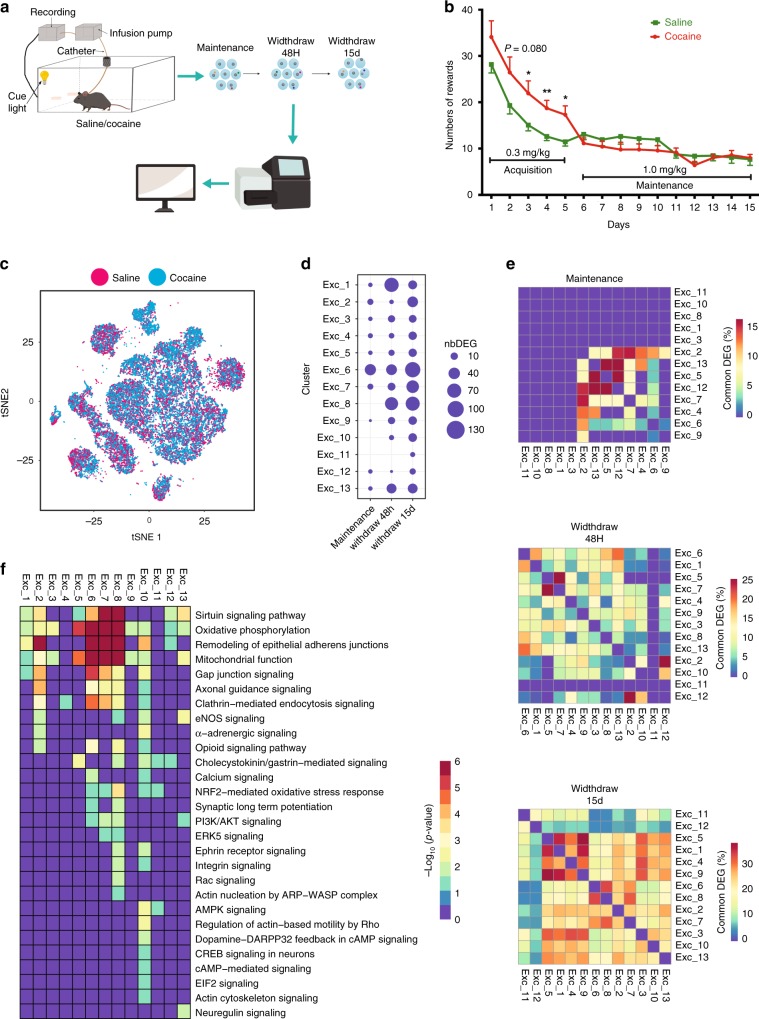
Fig. 6.
Chronic cocaine IVSA induces transcriptional changes in multiple PFC cell types. a Schematic diagram showing the IVSA experimental setting and workflow. Created with BioRender.com. b Reward earnt by lever pressing in IVSA mice (saline and cocaine groups) through acquisition and maintenance of a 15-day period. c t-SNE-plot showing the uniform distribution of cocaine and saline samples in the different cell-types. d Dot-plot showing the number of differentially expressed genes between cocaine and saline in each excitatory neuron subtypes at each time point (cutoff: FC > 1.5 and SC2P model phase2 FDR < 0.05, empirical Bayes statistic, limma package). e Heatmap showing the percent of commonly differentially expressed genes between the different clusters. Clusters tend to show cluster-specific differentially expressed genes with the highest overlap observed around 30% during the 15-day withdrawal. f Heatmap showing the -log10(p-value) of the pathways enriched for differentially expressed genes in the different clusters at the 15-day withdrawal

